There were 4.37 billion email users globally in 2023, and it’s set to reach 4.89 billion users in 2027. And with 69% of consumers confirming email as their preferred channel for brand communications, it’s easy to see why email plays such an important role in a business’s success.
But how can you make the most of your email performance and strategy? That’s where email analytics comes in. It’s a real game-changer for businesses, providing valuable insights into customer behavior, preferences, and engagement.
In this post, we demystify email analytics and cover:
Read on to learn how to take your email marketing to new heights.
Email analytics is a method of tracking data and information associated with your email activity. So, for example, that could include:
Email analytics gives you insights into your email strategies for customer service, sales, and marketing teams. You can use these email analytics insights to improve your team’s performance.
Let’s look at the most important email analytics metrics you should be tracking in the next section.
Also Read:
When you track the right email metrics, you can see exactly how your campaigns perform.
Metrics like open rate, click-through rate, deliverability, and time to reply each reveal a piece of the puzzle. By watching these numbers, you can spot what’s working and where to tweak your approach.
In this section, we’ll take you through 11 key email metrics you should track using your email analytics platform. We’ll also provide simple tips to help you improve your performance on these.
Let’s get started.
This metric tells you how many people are actually opening your emails.
Open rate = (Number of opened emails / Number of emails delivered) X 100
By tracking open rates, you can gauge the effectiveness of your subject lines, your reach, and the overall pull of your emails.
It practically shows you how well your emails grab attention in a crowded inbox. If people don’t even open your email, nothing else you do matters.
Most email service providers (ESPs) track this email analytics metric in some form or another, so you won’t have trouble tracking it.
According to a Mailmodo survey, the average email open rate was 20% to 50% for most respondents.
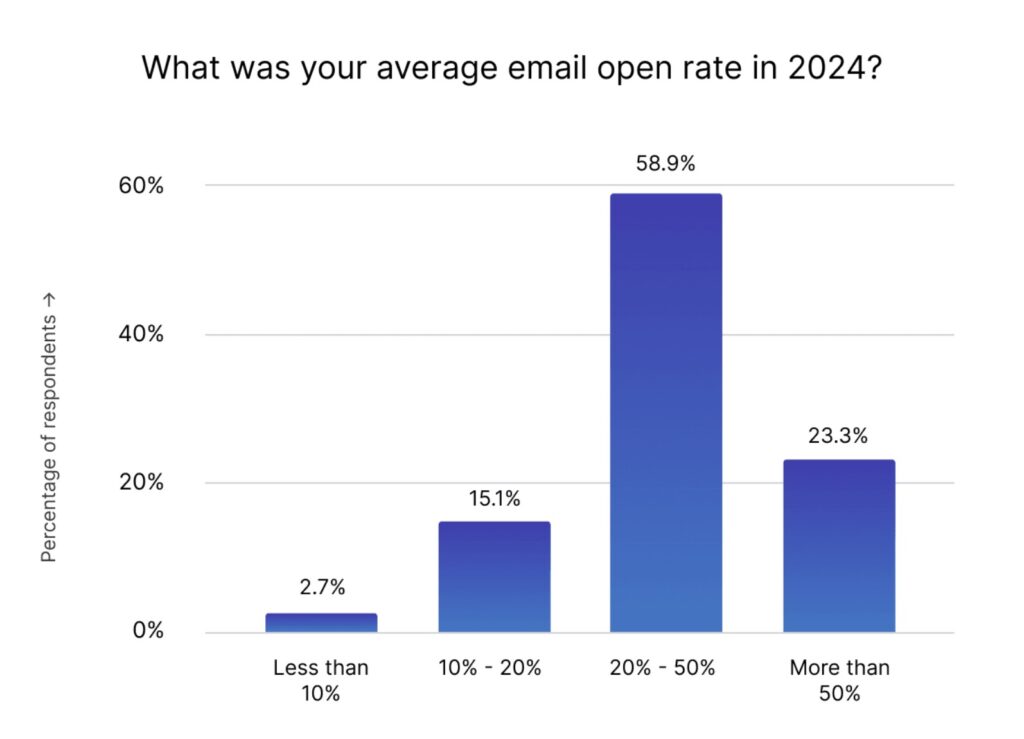
Image via Mailmodo
Here are some quick tips to boost your open rates.
CTR measures the percentage of people who click on links within your emails. It helps you understand if your content is engaging enough to drive action and directs you to areas of improvement for boosting engagement.
A high open rate but low CTR signals attention without engagement, showing that your email copy or links fall flat.
To calculate CTR, you need to divide unique clicks by emails delivered.
CTR = (Total clicks / Number of delivered emails) X 100
Some email analytics platforms also let you track clicks on individual links to see what resonates most.
Use these simple tips to improve your CTR.
CTOR zeroes in on the quality of your email content for those who have already opened it. It weeds out subject-line noise and focuses on in-email engagement.
A low CTOR suggests your layout, copy, or offer isn’t strong enough for people who showed initial interest.
To calculate CTR, you need to divide unique clicks by unique opens.
Click-to-open rate = (Total clicks / Number of emails opened) X 100
Here are some tips to boost CTOR.
Also Read:
Bounce rate tracks the number of emails that didn’t reach their intended recipients.
Bounces clog your reputation. If there are too many, email service providers start to distrust your domain, lowering future deliverability.
Distinguish between hard bounces (invalid email addresses) and soft bounces (temporary issue). A sudden spike in hard bounces means it’s time for a list audit.
Monitoring bounce rates is essential to maintaining a clean email list and ensuring your messages reach the right audience.
Divide total bounces (hard + soft) by total emails sent, or use an email analytics software solution that directly provides this metric.
Bounce rate = (Total number of bounced emails / Number of emails sent) X 100
Use these tips to boost your bounce rates.
Conversion rates measure the percentage of recipients who complete a desired action after clicking a link in your email. Whether it’s making a purchase, signing up for a webinar, or filling out a form, tracking conversions helps assess the effectiveness of your email campaigns.
This is where email translates into revenue or concrete goals. It tells you if your funnel, from the recipient’s inbox to checkout, is airtight.
Track different conversion types (sales, sign-ups, downloads) separately to see which email is driving which action.
Credit conversions back to specific email campaigns using UTM parameters and your email analytics platform. Then divide total conversions by emails delivered to calculate the conversion rate.
Conversion rate = (Number of conversions / Number of total emails delivered) X 100
To boost conversions, you should:
This metric indicates the number of subscribers who opt out of receiving further emails from your business.
Every unsubscribe is a data point telling you what went wrong. Were you sending emails too frequently? Did your emails have irrelevant content? Most subscribers find it better they leave than file a complaint.
Keeping an eye on unsubscribe rates helps you gauge the relevancy and value of your content, ensuring you maintain a healthy subscriber base.
Track spikes after big campaigns. If you see a jump after a particular email or series of emails, review that content and its timing.
Divide total unsubscribes by emails delivered in a period to calculate this metric.
Unsubscribe rate = (Unsubscribe number / Total emails delivered ) X 100
Many ESPs and email analytics platforms show you who unsubscribed and when, so you can spot patterns.
To reduce unsubscribes, you can:
Also Read:
It’s the percentage of recipients who mark an email as spam out of the total number of emails delivered.
Spam rate = (Number of spam complaints / Number of emails delivered) X 100
Hitting the spam button hurts your sender reputation fast. Even a tiny uptick can trigger stricter inbox filtering.
You should compare complaint rates across audience segments. If one group complains more, rethink the type of messages you send them.
Aim for a spam complaint rate well below 0.1%, as many ESPs will flag you if it goes higher.
Here’s what you can do to reduce this rate.
As the name suggests, this email analytics metric tracks how quickly your email list has grown or shrunk over time. It helps you evaluate the overall effectiveness of your lead generation efforts.
Even a healthy engagement rate can’t save a shrinking list. You need fresh leads and subscribers to replace unsubscribes and bounces.
Break it down by channel (website pop-ups, social media, events) so you can identify and focus on the highest-performing sources.
List growth rate = [{(Number of new subscribers) – (Number of unsubscribes + Spam complaints)} / Total number of email addresses on your list] X 100
The following tactics can help you improve your list growth rate.
Deliverability rate tells you how many of your emails actually landed in inboxes, instead of landing in spam folders or getting blocked outright.
Deliverability rate = (Number of emails delivered sent / Number of emails sent) X 100
Track spikes or sudden dips after changing domains, shifting ESPs, or sending big email blasts. A sharp drop usually flags authentication issues or list problems.
Most ESPs and email analytics platforms report this metric, so it should be easy enough for you to track.
Here are some things you can do to improve email deliverability.
ROI measures the profitability and cost-effectiveness of your email marketing efforts. Specifically, it measures the money you earn versus your spending on email marketing.
Overall ROI = [($ in additional sales made – $ invested in the campaign) / $ invested in the campaign] X 100
Be sure to include all costs—design, platform fees, copywriting, and even staff time.
ROI connects your campaigns directly to the bottom line, so you know whether your email marketing efforts are paying off.
You should monitor ROI after a major campaign or after switching to a new tool to measure effectiveness.
Here are some tips to boost email marketing ROI.
Time to reply measures the average time it takes for you or your team to respond to emails. By monitoring this metric, you can assess your email communication efficiency, identify potential bottlenecks, and improve customer satisfaction by reducing response times.
Your average reply time shows how quickly you acknowledge customer questions or sales leads. Fast replies and quick resolution build trust, keep prospects engaged, and turn questions into purchases.
On the flip side, slow responses frustrate people, drive them to competitors, and can tank your customer satisfaction scores.
Follow these tips to ensure fast responses to customer inquiries.
Now that you understand the key email analytics metrics you should track, let’s cover some tools you can use to track these.
Also Read:
If you’re looking for some great email analytics tools, here are our top five picks you can consider.
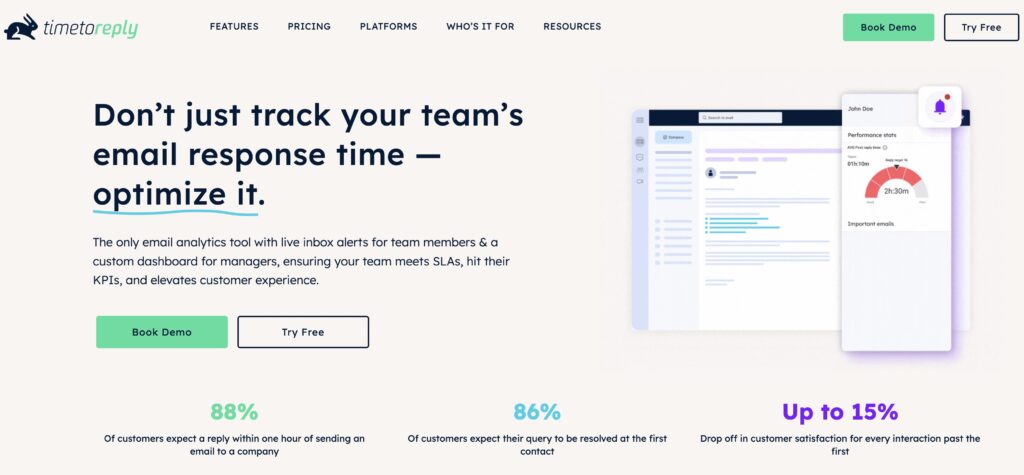
Image via timetoreply
As one of the top email analytics tools, timetoreply focuses on measuring and improving email response times. It offers real-time email analytics, customizable reports, and team performance tracking. With its emphasis on response time metrics, timetoreply helps businesses streamline their customer service, improve lead response times, and boost overall efficiency.
Overlap, timetoreply is the go-to email analytics and reporting software solution for businesses aiming to boost customer service and sales mojo by turbocharging email response times.
Key features
Pricing
It offers three plans:
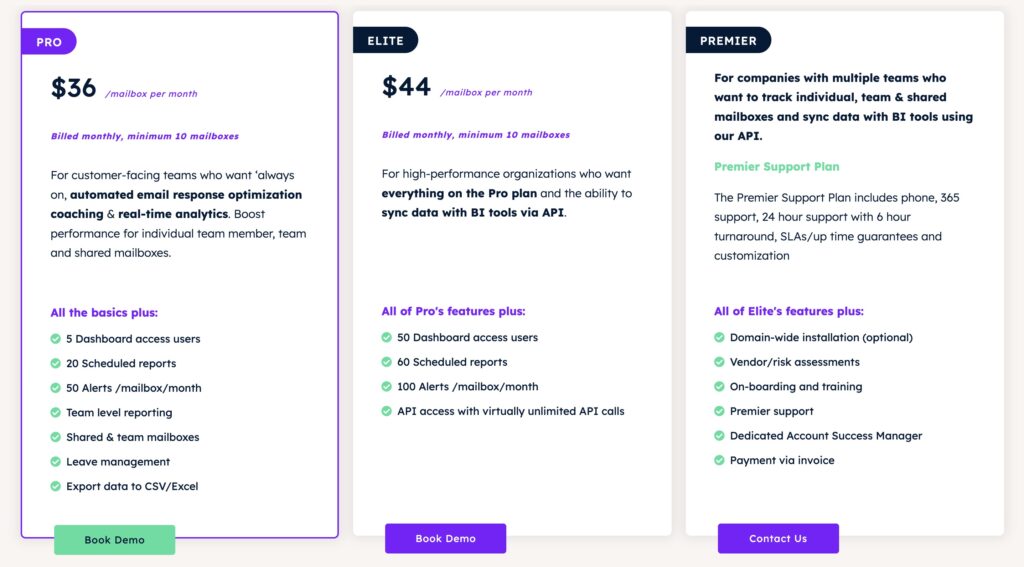
Image via timetoreply
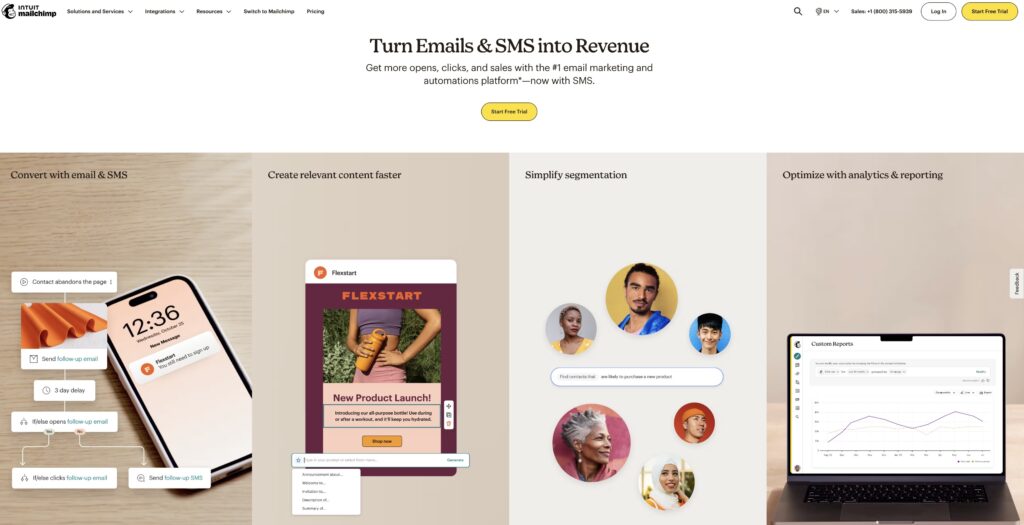
Image via Mailchimp
Mailchimp is a popular email marketing platform that also offers robust email analytics features. It provides detailed campaign metrics such as open rates, click-through rates, and conversion tracking. Mailchimp’s user-friendly interface, segmentation options, and automation capabilities make it a versatile tool for email analytics.
While Mailchimp excels as an email marketing tool, some users have found limitations regarding advanced reporting and customization options. It doesn’t tell much about how your staff handles incoming customer emails.
Businesses with more complex email analytics needs may find the reporting capabilities somewhat limited compared to specialized email analytics tools.
Our verdict? Mailchimp is a reliable and user-friendly email marketing platform with comprehensive campaign metrics, segmentation options, and automation capabilities.
Key features
Pricing
It offers the following plans:
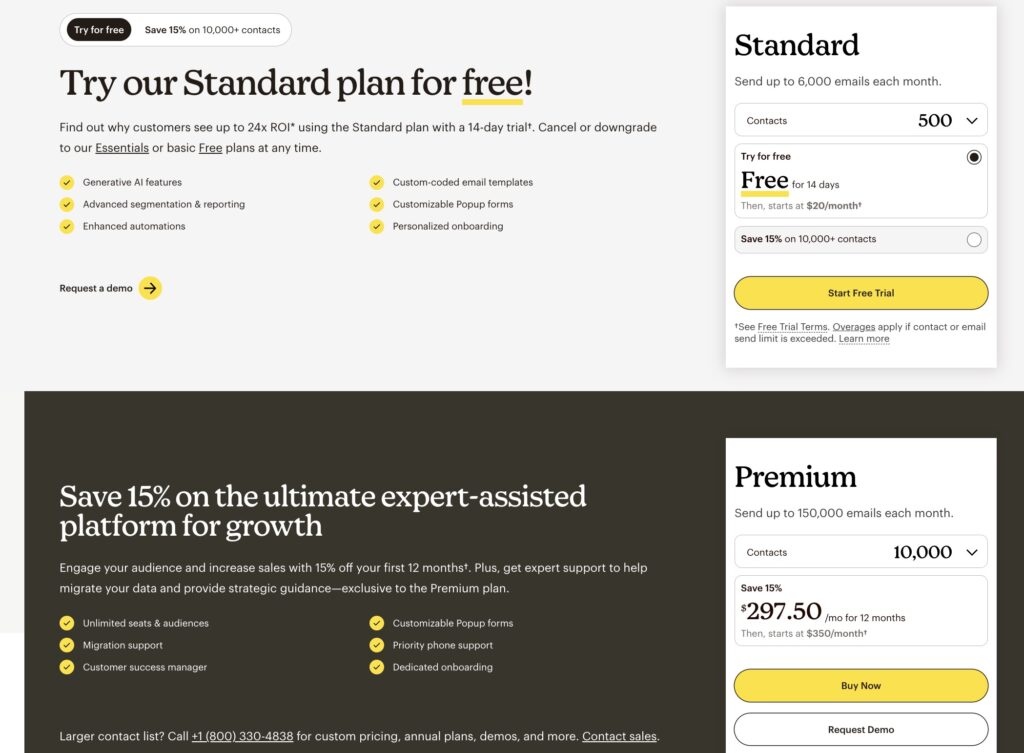
Image via Mailchimp
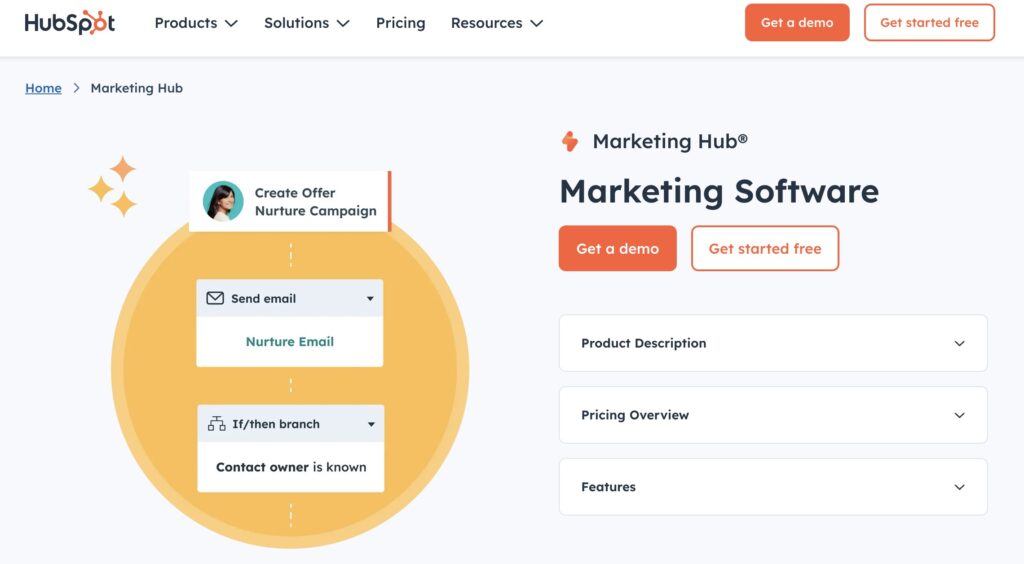
Image via HubSpot
HubSpot provides metrics like open rates, click-through rates, and engagement tracking. With HubSpot’s email analytics capabilities, you get an inside look at how your emails perform, from open rates to click-through rates and engagement tracking. It’s like having a backstage pass to see precisely what’s happening with your email campaigns.
Just a heads up, HubSpot’s pricing might not be for the faint of heart, especially if you’re starting out or on a tight budget. There might also be a bit of a learning curve to harness the full power of this platform.
Key features
Pricing
It offers the following plans:

Image via HubSpot
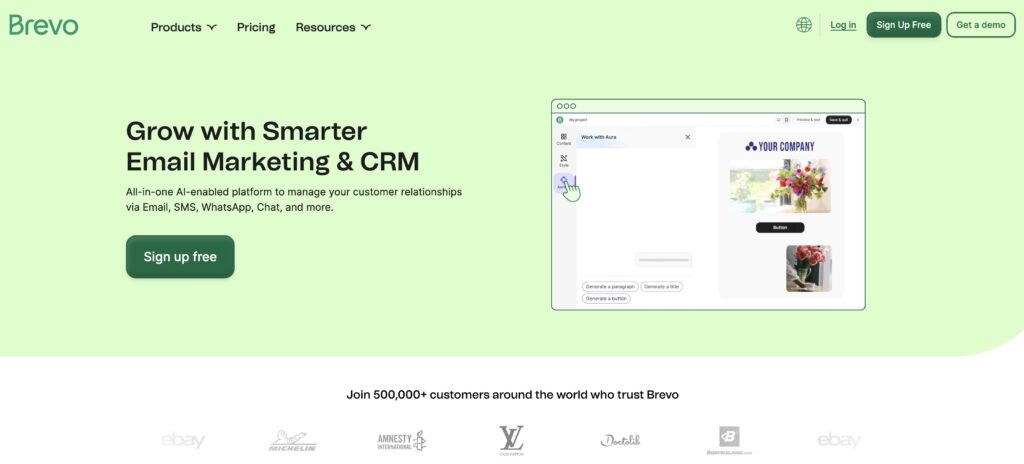
Image via Brevo
Brevo is a reliable solution for businesses looking to streamline their email marketing efforts and gain valuable insights into their campaigns.
Users highlight its interface and point out that it’s easy to navigate and to set up email campaigns. This is great for businesses new to email marketing or for those that prefer a simple and straightforward interface.
While Brevo offers email analytics basics, it may not have all the bells and whistles of other platforms out there.
If your email analytics needs are more complex, you might want to explore other email analytics tools.
Key features
Pricing
It offers a free plan and three paid plans:
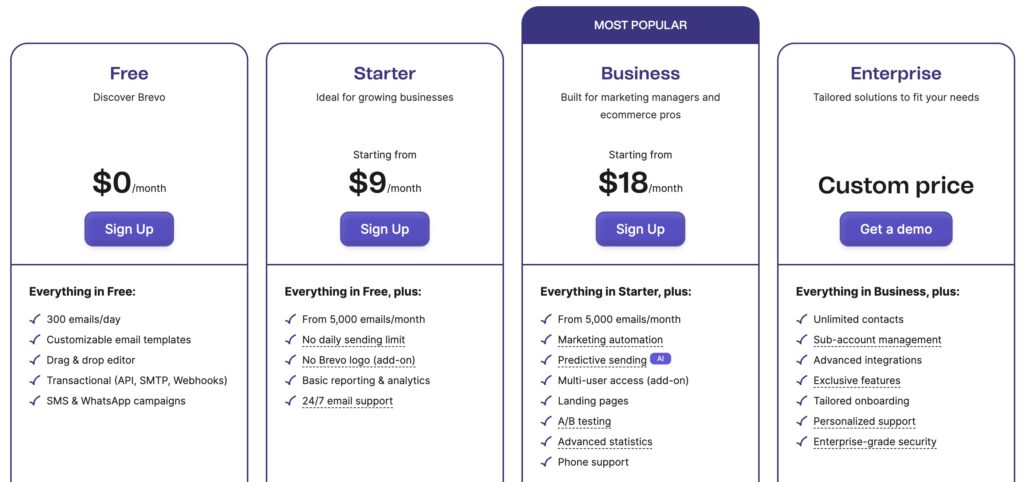
Image via Brevo

Campaign Monitor is a user-friendly email marketing platform known for its clean design and strong email analytics features. It gives marketers a clear picture of how their email campaigns are performing with real-time tracking for opens, clicks, bounces, and unsubscribes.
The reporting dashboard is simple to navigate, making it easy for users at any level to see which emails are getting the most engagement and where improvements are needed.
Beyond individual campaign stats, Campaign Monitor also provides comparative reports across multiple campaigns, helping you spot trends over time
Key features
Pricing
It offers a free plan and three paid plans:
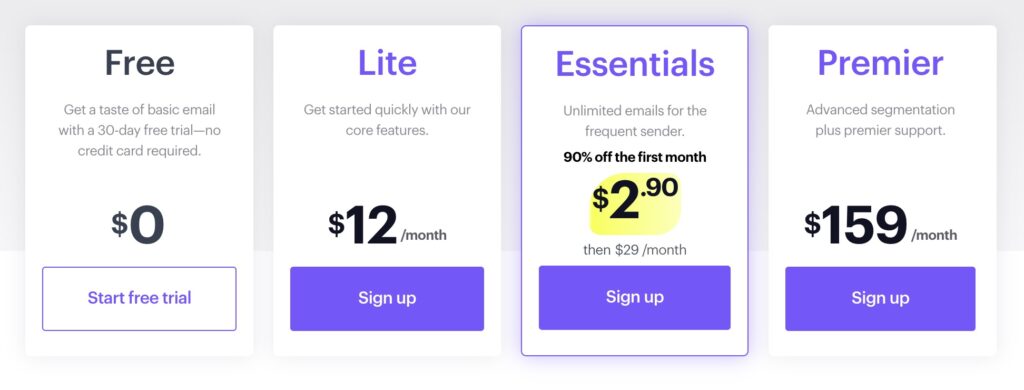
Image via Campaign Monitor
Also Read:
1. What is email analytics?
Email analytics is simply the process of tracking and measuring key metrics related to your email marketing campaigns or overall email performance.
You can track how many people open, click, or reply to your messages. This helps you learn what works and what needs fixing.
2. Why is email analytics important for businesses?
By checking your email data, you can find out what your customers like. You can send more of the messages they enjoy. This boosts engagement and can lead to more sales or better customer relationships.
You can also track how quickly your customer-facing teams respond to inquiries. This helps you assess your team’s performance and may even help you win more leads and sales.
3. Does Gmail have email analytics?
While you can see some basic things like read receipts, Gmail doesn’t really provide email analytics on the various metrics. You will need to use a third-party email analytics tool to get detailed reports and metric-tracking capabilities.
4. How to analyze emails in Gmail?
First, turn on read receipts if you use Google Workspace. Next, look at your Sent and Draft folders for reply trends. Then install a Gmail extension or add-on that tracks opens, clicks, and response times.
You can even use email analytics tools that provide in-depth coverage and reporting.
5. Which is the best email analytics tool?
The right tool depends on what you need. Some focus on campaign performance, while others help you manage team replies. If you want to track and speed up your company’s reply times, timetoreply offers live dashboards and alerts that keep your team on track.
Also Read:
To wrap up, email analytics shine a light on the health of your campaigns. It helps you track key metrics like open rates, click-throughs, deliverability, reply rates, and even how fast you reply.
Email analytics can help you gain insights into your email performance, both from a marketing perspective and a customer service angle.
Each of the five email analytics platforms we’ve listed has unique strengths.
If you want to boost your customer service or sales outreach, TimeToReply can help you improve your email reply times.
Ready to see faster replies and happier customers? Try timetoreply today and give your support and sales teams the edge they need.
Get live inbox alerts and reply quickly to customer emails with timetoreply