Customer churn is one of the biggest challenges businesses face. Losing clients reduces revenue and also increases the cost of acquiring new customers.
There’s no doubt that businesses make efforts to retain clients. But without clear insights on why they tend to leave, retention efforts can feel like shooting in the dark. This is why customer churn analysis has become an important aspect of business retention strategies.
Customer churn analysis allows you to dig into data, uncover trends, and identify the signs that lead to churn.
In this post, we break down customer churn analysis in a clear, practical way. By the end, you’ll know how to use customer churn analysis to improve customer loyalty and build long-term business growth.
Let’s get started.
Customer churn analysis involves studying business data to understand why people stop doing business with you. It includes looking at patterns in customer experience, behavior, usage, and feedback to find the reasons behind customer loss.
Customer loss directly impacts revenue and long-term stability, which is why customer churn analysis is critical for sustainable growth. Below are some of the key reasons why businesses should focus on customer churn analysis.
In short, customer churn analysis helps businesses understand customer behavior, reduce customer churn, and build lasting customer loyalty.
Not all customer churn happens for the same reason. To reduce churn effectively, you need to understand the different types and what causes each one. This allows you to respond with targeted, practical actions.
Below are the common types of customer churn every business should monitor closely, as explained in the Churnkey State of Retention 2025 report.
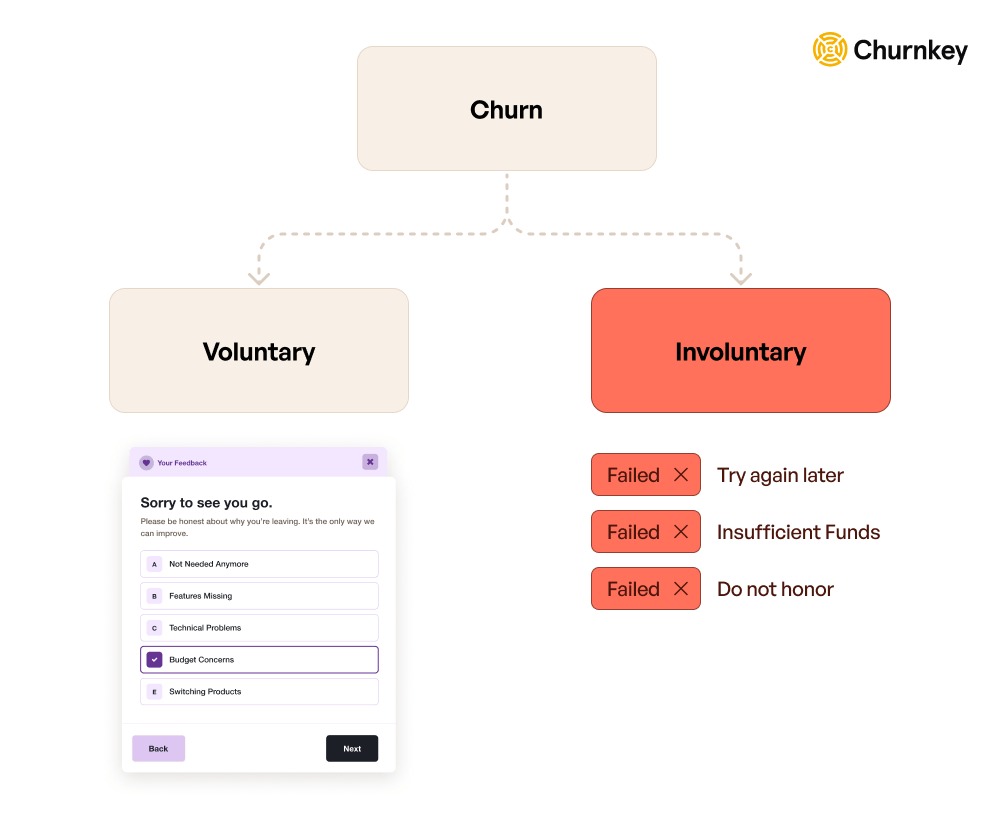
Image via Churnkey
This type of churn happens when customers choose to stop using your product or service. It is typically driven by poor customer experience, declining perceived value, or unmet expectations.
In some cases, customers may leave because they no longer see value or they’ve found a better alternative.
Voluntary churn does not happen without warning. Customers tend to show signs before they leave. These signs may include reduced product usage or repeated complaints.
Some customers may also stop engaging with support or success teams altogether. Customer churn analysis will help identify these signals early so teams can intervene and improve customer service before the customer leaves.
Involuntary churn occurs when customers leave due to reasons outside their control. In this case, customers do not choose to stop using your service, but are removed because of certain issues.
Common causes of involuntary churn include expired or declined credit cards, failed payments, billing errors, system issues, or account access problems. Sometimes customers are unaware their subscription has ended until they lose access.
Although this type of churn is not caused by dissatisfaction, it still impacts revenue and customer relationships.
Tracking different types of churn helps businesses understand why customers leave and when it happens.
Also Read:
Customer churn analysis may sound complex for support teams, but it becomes easier when broken down into clear stages. Below is a detailed, step-by-step process to help you carry out customer churn analysis without unnecessary complexity.
Before analyzing anything, you need a clear and shared definition of churn. Having a clear definition ensures everyone is working with the same understanding.
For subscription-based businesses, churn usually means a customer cancels their subscription or does not renew it. For ecommerce businesses, it may mean a customer who has not purchased within a specific time period.
For SaaS businesses, churn can also include inactive users who stop logging in or engaging for a set period.
This step is important because your churn definition determines what data you collect. Once churn is clearly defined, you can identify churned customers and separate them from active ones.
The next step is to decide the time frame for your churn analysis. This will help you understand when customers are leaving and how frequently they do.
Some businesses track churn monthly, especially subscription or SaaS companies with short billing cycles. Others may analyze churn quarterly or yearly, particularly if customers make purchases less frequently.
Shorter time periods help identify sudden changes, such as churn after a price increase, product update, or marketing campaign. Longer time periods reveal broader trends and seasonal patterns.
Maintaining a consistent time period for your customer churn analysis is important. It allows you to compare churn across different phases of your business.
For example, you can analyze churn before and after improving onboarding. You can also track it when launching a new feature or changing your pricing structure.
This approach provides insights into which strategies are driving retention and highlights areas that need adjustments.
Customer churn analysis is only as effective as the data behind it. This step involves gathering all relevant data that can help explain customer behavior before they churn.
Important data includes customer profiles, signup dates, subscription plans, purchase history, and product usage. You can also track login frequency, customer support tickets, complaints, survey responses, reviews, and billing or payment information.
This data often exists in multiple tools, such as CRM platforms, customer support systems, and billing tools. Centralizing it in one place supports easier customer experience analysis and better visibility.
Also Read:
You may miss important insights if you analyze all customers as one group. Segmentation will help you understand churn more clearly by breaking customers into smaller groups.
You can segment customers based on lifecycle stage, such as new users, active users, or long-term customers. Also, segment them by usage behavior, like high usage versus low usage.
Other segments can be based on subscription plans, industries, locations, or customer value. You can also create segments like free users vs paid users or small businesses vs enterprise customers. With segmentation, you can identify which groups churn the most and why.
The next step in customer churn analysis is to identify actions that signal churn. To uncover these patterns, use tools that provide insights into customer behavior. Tools like customer relationship management (CRM) platforms are effective as they help track interactions.
CRMs store all customer information in one place, including purchase history, subscription status, and customer engagement activity. Many CRMs include built-in reports and dashboards that allow you to track churn rates.
If your business sends emails or marketing campaigns, email analytics tools can also help track churn. For example, low email engagement or unsubscribes can be early warning signs of disengaged customers.
These tools often provide reports showing who opens emails, clicks links, or stops interacting, which can be linked to potential churn. The goal is to find patterns and behaviors that are common among customers who leave.
After using tools to spot patterns, the next step is to dig deeper and find the actual reasons why customers leave. Knowing the cause is essential to fixing the problem.
You can also use surveys and feedback tools to gather insights on customer experiences. A short cancellation survey asking why a customer left often provides valuable qualitative insights.
Tools like Typeform, SurveyMonkey, or Intercom are effective for this. Additionally, analyzing customer support tickets and reviews can show common complaints or pain points.
With this data, you can prioritize your retention strategies and focus on the issues that will make the biggest difference in keeping customers.
Once you’ve identified why customers are leaving through customer churn analysis, the next step is to take action to improve retention. This means implementing strategies to engage and retain at-risk customers and then measuring their effectiveness over time.
Begin by designing targeted interventions to enhance customer experience based on the insights from your customer churn analysis. For example, if your analysis shows that customers are leaving due to poor onboarding, you could create a step-by-step onboarding series, in-app tutorials, or one-on-one training sessions.
If churn is linked to payment issues, test strategies such as sending reminders for upcoming renewals or offering flexible payment options.
These interventions should be specific, measurable, and aligned with the causes identified in your customer churn analysis.
Also Read:
To understand why customers leave and how to stop it, businesses need to track the right customer retention metrics. Monitoring core business metrics helps businesses measure the impact of churn and evaluate their strategies.
Below are some important metrics businesses should track as part of a customer churn analysis process.
This is a measure of the percentage of customers who stop doing business with you during a specific period. It is often the basic metric businesses examine when evaluating customer retention.
A rising churn rate is often the first sign that something is wrong. This could signal ongoing issues like unclear value, unmet expectations, or poor customer service performance. It could also point to a major problem, such as a pricing change or product update.
Tracking customer churn rate over time makes it easier to spot trends and investigate the root causes.
Revenue churn rate focuses on the amount of revenue lost from existing customers during a given period. This metric is important for subscription-based and B2B businesses.
Unlike customer churn rate, revenue churn rate shows the financial impact of churn. For example, losing one enterprise customer may hurt revenue more than losing several smaller accounts.
When businesses monitor churn rate, they can understand whether it is affecting their valuable customers and causing revenue leakage.
Usage metrics track how often customers use your product and which features they rely on. Common examples include login frequency, feature adoption, and session duration.
Low or declining usage is often an early warning sign of churn. These metrics are important in customer churn analysis because they show changes in customer behavior before they cancel.
Customers who use fewer features or log in less frequently may be slowly disengaging. Monitoring usage trends allows businesses to identify at-risk customers early.
Also Read:
These metrics show how well your support team is delivering a positive customer experience. Customer support metrics include total support tickets, response times, resolution times, and the frequencies of repeat issues.
A high volume of unresolved issues or long response times can frustrate customers and increase churn.
Tracking customer service metrics helps businesses connect service quality with churn patterns. These metrics show if customers are leaving because of poor experiences rather than product issues.
This customer success metric predicts the total revenue generated by a customer throughout their relationship with your business. It highlights the long-term value of retaining customers.
When churn increases, CLV usually decreases because customers leave sooner than expected. When businesses monitor CLV, they can track whether their retention strategies are improving long-term profitability.
It also helps customer-facing teams decide how much to invest in customer service, marketing, and retention efforts.
This metric measures how satisfied customers are with your product or service. It is collected through short surveys after key touchpoints. You can ask customers to rate your product or service on a scale ranging from very dissatisfied to very satisfied.
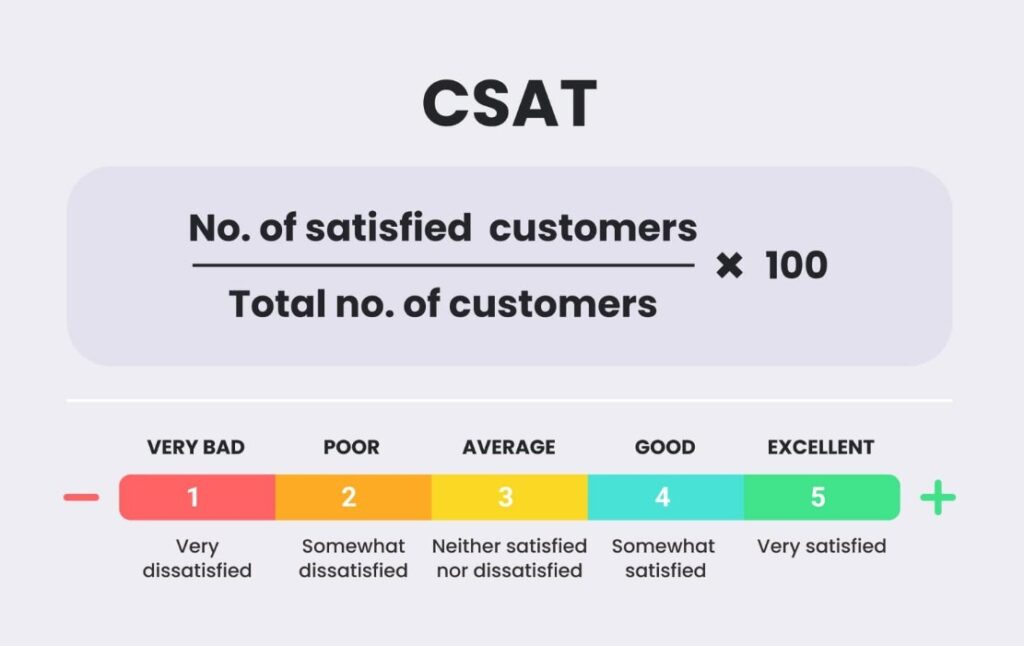
Image via Arahoster
Low CSAT scores often signal dissatisfaction that can lead to churn if not addressed. Tracking CSAT over time helps businesses identify weak points in the customer journey.
NPS gauges how likely customers are to recommend your business to others. It categorizes customers as promoters, passives, or detractors.
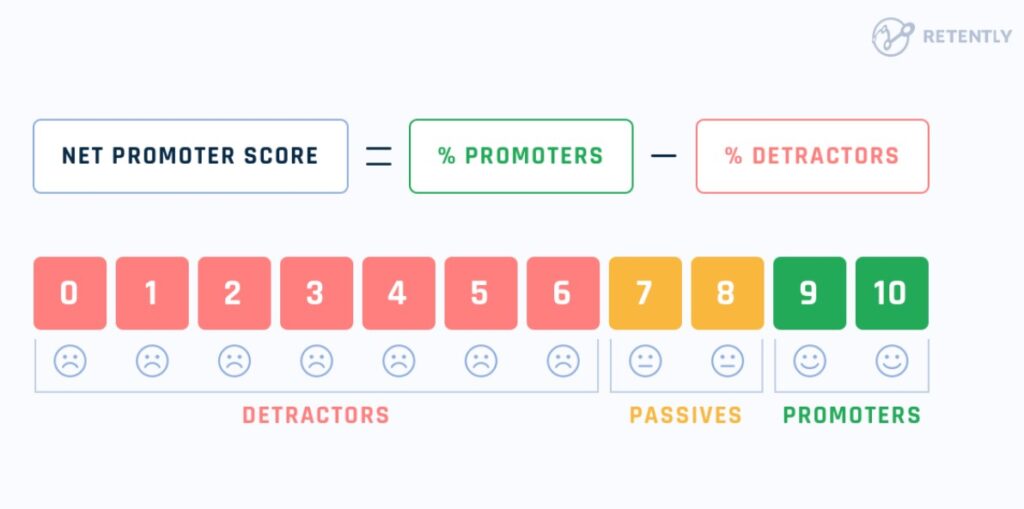
Image via Retently
Customers with low NPS scores have a higher risk of churn. Tracking NPS helps businesses understand customer sentiment and brand perception.
In customer churn analysis, NPS measures customer loyalty, providing a clear signal of who may stay or leave.
Customer renewal rate measures the percentage of customers who renew their subscriptions or contracts at the end of a billing period. Subscription-based or recurring revenue businesses can use this metric to predict churn.
Unlike general satisfaction or engagement metrics, renewal rate shows actual decisions to stay or leave. For example, if 100 customers are eligible to renew this month and 85 do, the renewal rate is 85%. A 15% shortfall represents churn.
Tracking this metric over time allows businesses to spot trends, such as declining renewals after a product change, pricing adjustment, or service issue.
Overall, monitoring key customer metrics together helps businesses gain a more accurate understanding of churn. A well-rounded customer churn analysis approach focuses on behavior, satisfaction, and revenue.
Also Read:
Customer churn analysis becomes more effective when businesses use the right tools to enable it. These tools help collect customer data, organize it, and turn it into insights that teams can act on.
Below are some categories of tools that support customer churn analysis:
CRM tools support customer churn analysis by giving businesses a centralized and organized view of every customer. These tools store customer details, purchase history, communication records, and account status in one place. This makes it easy to monitor each customer relationship over time.
For example, CRM tools like Pipedrive provide a comprehensive record of a customer’s activities across various stages. This makes it easy to spot reduced engagement or stalled activity, which are common warning signs in customer churn analysis.
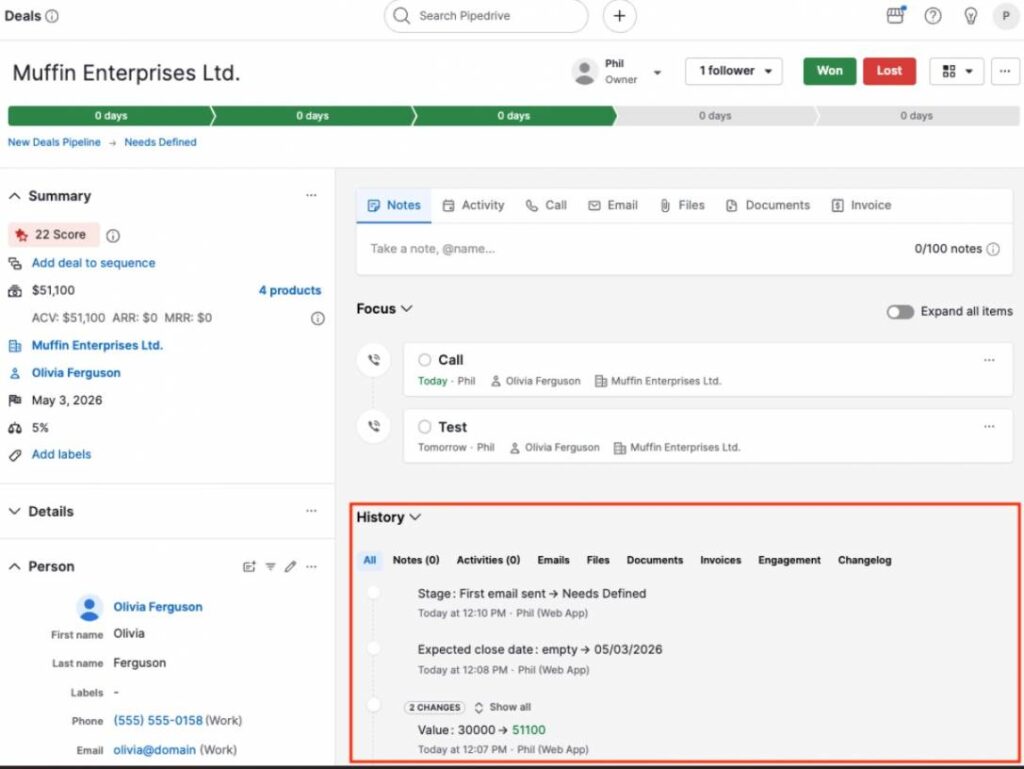
Image via Pipedrive
These tools also help connect churn to specific customer segments. Businesses can compare churn rates across industries, locations, or contract types.
Customer support tools help track customer issues, questions, and complaints. They record support tickets, average response times, resolution times, and customer satisfaction after support interactions.
These tools are essential for customer churn analysis because poor support experiences are a major cause of customer loss.
Helpdesk tools also identify recurring issues that affect many customers. For example, a customer service software platform like Freshdesk allows businesses to track ticket performance and support quality. It also shows the level of resolution and service level agreement achieved.
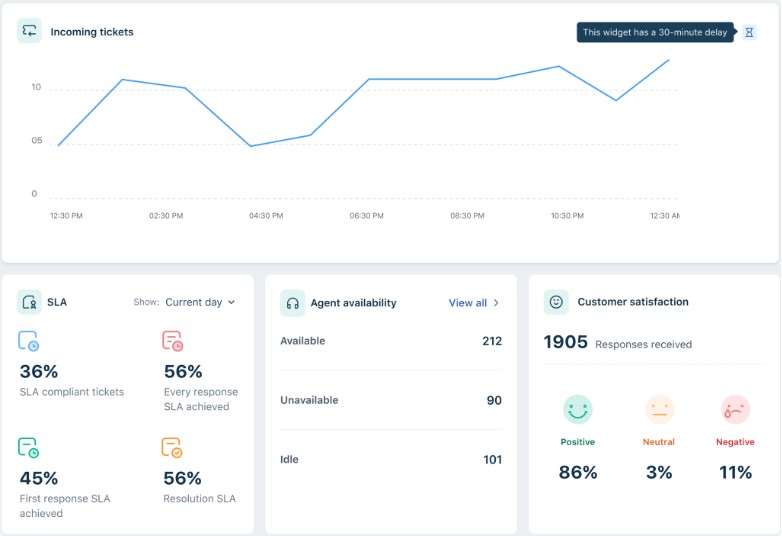
Image via Freshdesk
These tools support customer churn analysis by showing how customers use a product or website. They help track actions such as logins, page views, feature usage, session duration, and drop-off points.
Customer behavior often changes before churn happens. A customer may log in less often, stop using key features, or abandon important workflows. With analytics tools, you can detect these changes.
A good example is Amplitude, a product and web analytics tool that allows you to track customer behavior across channels, campaigns, and pages. The dashboard displays user engagement and bounce rates for various channels.
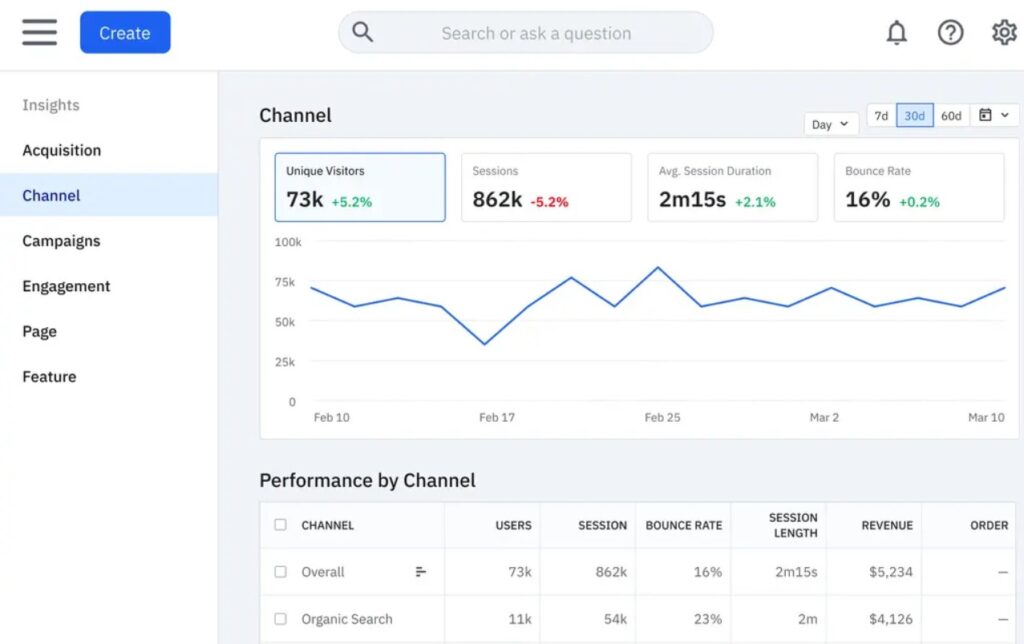
Image via Amplitude
Customer feedback tools are used in customer churn analysis for capturing the voice of the customer. These tools collect feedback through surveys, ratings, and forms at key points in the customer journey.
Canny is one example of a customer feedback tool that lets you gather product feedback from customers. It analyzes the responses and requests, and indicates the customer’s likelihood of renewal or churn.
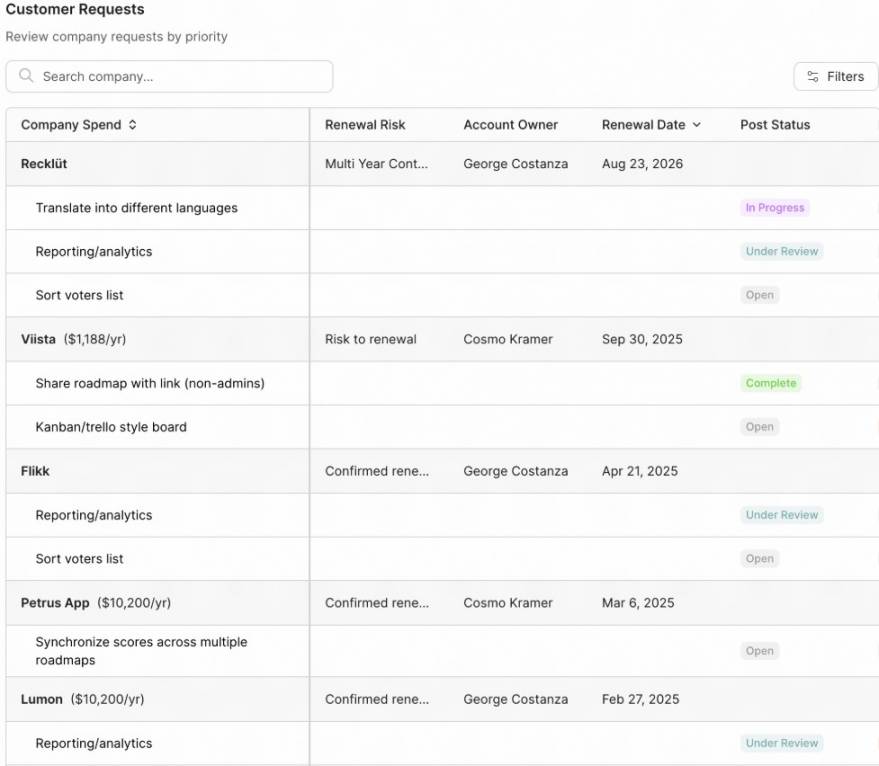
Image via Canny
While behavioral data shows what customers do, feedback explains how they feel. Combining both creates a stronger churn analysis framework. Businesses can address not just symptoms, but also the root causes of churn.
For SaaS businesses, subscription and billing analytics tools are essential for customer churn analysis, as recurring payments tie directly to customer retention.
These tools track how customers pay, renew, downgrade, or cancel their subscriptions. They support customer churn analysis by tracking churn at key billing moments. Many customers churn at predictable points such as the end of a free trial, during a plan upgrade, or at renewal time.
Subscription analytics tools make these moments visible by tracking trial conversions, renewal rates, and cancellation timing. For example, subscription billing tools like Recurly provide an analytics dashboard that helps you track your churn rate monthly and compare it with industry benchmarks.
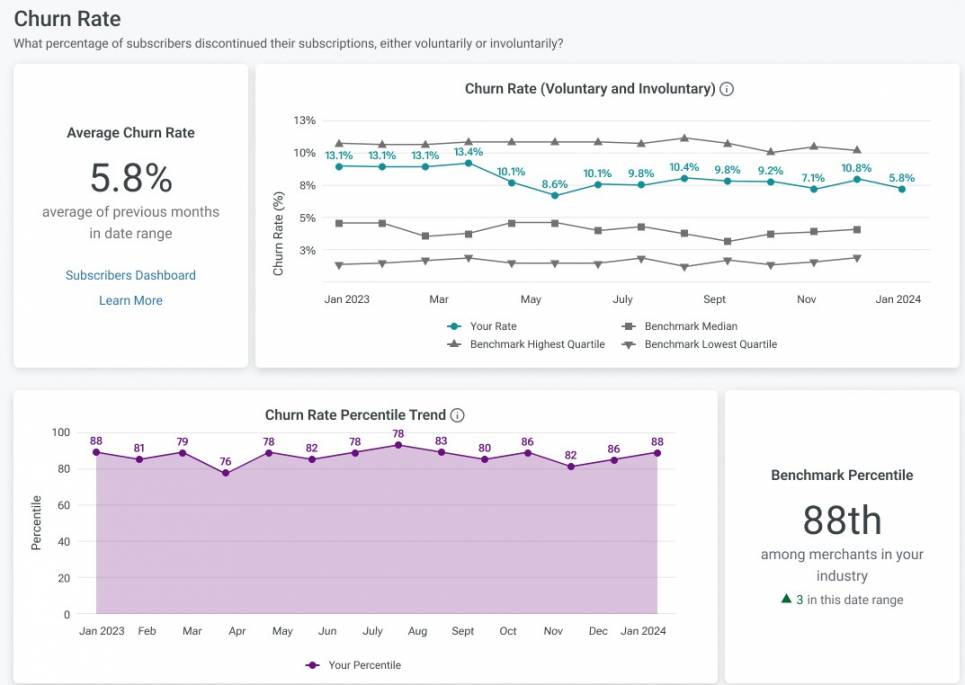
Image via Recurly
Another important benefit of these tools is revenue clarity. Subscription and billing tools show metrics such as monthly recurring revenue, revenue churn, and customer lifetime value. This helps businesses understand the financial impact of churn.
Also Read:
1. How often should businesses perform customer churn analysis?
Businesses should perform customer churn analysis regularly. For most companies, a monthly review works because it helps spot trends early. Fast-growing or subscription-based businesses may benefit from weekly checks on key churn signals.
2. What data is needed for customer churn analysis?
Customer churn analysis requires both behavioral and feedback data. This includes product usage data, login frequency, feature adoption, support tickets, billing history, and customer feedback from surveys or reviews. Combining these data points helps businesses understand not just when customers leave, but why they leave.
3. What is a good customer churn rate for B2B companies?
A good customer churn rate for B2B companies depends on the business model. For most B2B SaaS companies, a monthly churn rate below 2% is generally considered healthy. However, enterprise-focused businesses often aim for even lower churn.
4. Which teams should be involved in customer churn analysis?
Customer churn analysis should involve multiple teams including sales, customer success, and product teams. Customer success teams provide insight into customer behavior and support issues. Product teams use churn insights to improve features and usability. Sales and marketing teams benefit from understanding why customers leave so they can set better expectations and improve targeting.
5. What are the biggest warning signs of customer churn?
Changes in customer behavior often appear before churn happens. Common warning signs include reduced product usage, fewer logins, skipped renewals, unresolved support issues, and negative feedback. Customer churn analysis helps track these signals early so you can take preventive action.
6. What actions can businesses take after completing customer churn analysis?
After completing customer churn analysis, you should act on the insights. This may include improving onboarding, offering personalized support, adjusting pricing plans, fixing product issues, or re-engaging at-risk customers. The goal is to turn churn insights into retention actions that improve customer experience.
7. Can customer churn analysis predict future churn?
Yes, customer churn analysis can help predict future churn. When you study past customer behavior, engagement, and purchase patterns, you can identify churn signals or indicators that often appear before a customer leaves. With this information, you can create models that estimate which customers are likely to churn in the future.
8. What tools are best for customer churn analysis?
There are many tools available to help businesses perform customer churn analysis, including:
Customer churn analysis provides actionable insights that help businesses reduce churn and maximize retention. The key to success is making customer churn analysis an ongoing part of the business process.
Set clear goals, segment customers, combine behavioral data with feedback, and test interventions. Over time, these efforts will help improve customer experience and build loyalty.
The more a business understands its customers, the better it can create experiences that keep them engaged and satisfied. Tools like timetoreply can track engagement and monitor customer behavior, enabling timely interventions to reduce churn.
Get live inbox alerts and reply quickly to customer emails with timetoreply

Head of Customer Success @ timetoreply
Barry Blassoples is the Head of Customer Success at timetoreply, where he helps customer-facing teams boost revenue and protect brand reputation by providing actionable insights to improve their business email response times. He has over 15 years of leadership experience across customer success, sales, and marketing roles in high-growth tech companies.


Trusted by high-performing inbound sales teams and customer-facing teams globally.
Close more deals and delight more customers with the faster, smarter, deeper email analytics and performance optimization software that works straight from your team’s inbox.