
With customer experience analytics, you can collect and analyze data from customer interactions. This includes customer feedback, behavior, and operational data.
This process uncovers recurring problems and helps you spot churn risk. Businesses that act on this data early can improve customer satisfaction, loyalty, and retention.
Customer experience analytics is the process of collecting and analyzing data from customer interactions, like support conversations or product reviews. This helps you identify pain points and track customer satisfaction.
Then, you can improve your product or customer service and increase retention. If you don’t act on customer feedback, you risk losing customers to competitors. In fact, globally, organizations could lose up to $3 trillion of potential revenue in 2026, according to Qualtrics.
In this guide, you’ll understand customer experience analytics and why it matters for your business. We’ll also explain how to collect data for customer experience analytics. You’ll also learn strategies to increase customer retention.
Customer experience (CX) analytics involves collecting and analyzing data from customer interactions.
A customer interaction can include visiting your website or using your product. It can also include contacting support, leaving reviews, or making a purchase.
The goal is to understand recurring issues and act on them to improve the customer experience. This reduces churn and increases retention.
Customer experience and customer service analytics are usually confused, but they’re different:
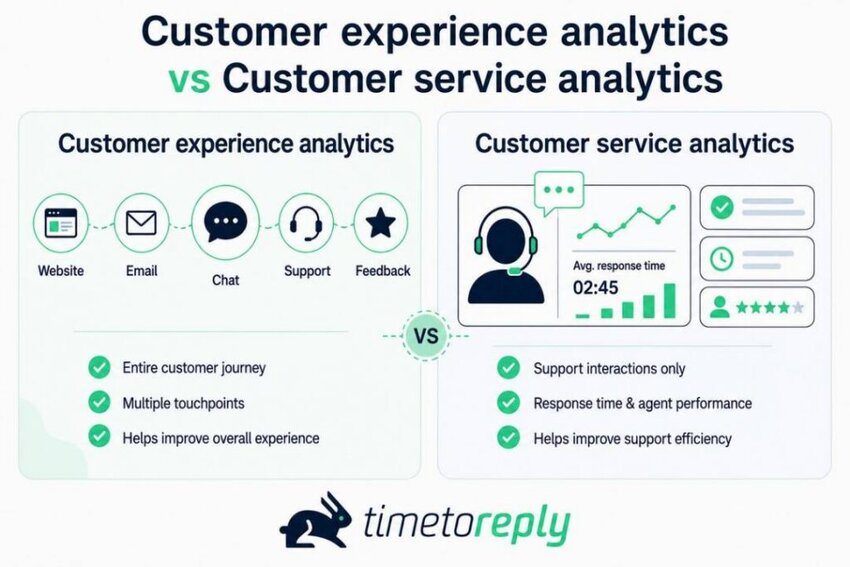
It’s the process of collecting and analyzing customer interaction data. This data includes reviews, support conversations, or actions customers take on your website.
These customer insights help you improve your product or service, which increases satisfaction and retention.
Also Read:
CX data can be categorized into operational signals (O-data) and relationship signals (R-data).
O-data tells you how your business handles customer queries, such as how fast you respond. R-data shows how customers feel about your brand, such as whether they’re satisfied with the product.
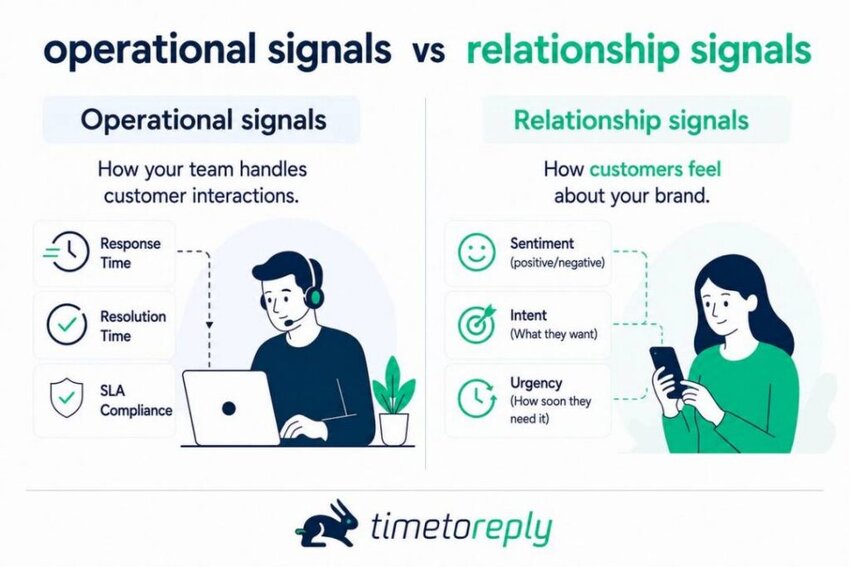
Operational signals help you understand how your team performs during customer interactions. These signals include response time, resolution time, and SLA compliance.
For example, a customer sends a support request on Monday morning. Your team replies within 20 minutes and resolves the issue that afternoon. Those timings become operational signals.
Teams that manage customer support through email can use email analytics software such as timetoreply. It helps you track operational signals. You can measure response time, resolution time, and SLA compliance.
Managers can get a clear picture of support performance and work on improving it:

Image via timetoreply
For example, with the timetoreply tool, Telarus reduced response time from seven to two hours.
Relationship signals show how customers feel about your business. They include sentiment, intent, and urgency. For example, if customers say:
However, these signals can be hidden in emails or support messages, making them harder to spot. This is where email analytics tools like timetoreply come in. One key feature is the relationship intelligence AI layer, called Smart Data.
It automatically identifies sentiment, intent, and urgency. This helps support teams prioritize urgent issues and improve response time:
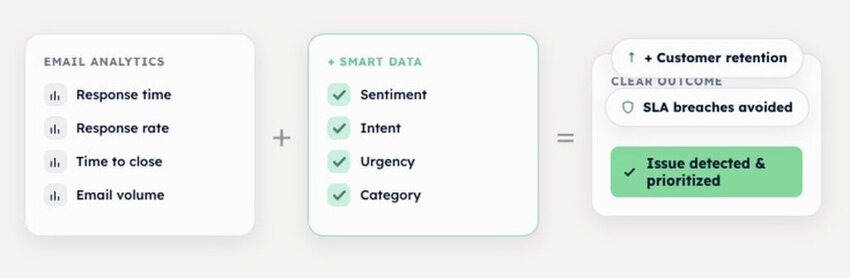
Image via timetoreply
Operational signals tell you what happened during customer interactions. For example, how quickly your team responded, resolved issues, and met SLA targets.
Relationship signals tell you how customers feel about your product or service. For example, whether they were satisfied after a service interaction or need urgent help.
Also Read:
Customer experience analytics has five key benefits. These include reducing churn and increasing retention, and improving product-market fit. They also include improving customer lifetime value (CLV), reducing support costs, and building a customer-centric culture.
Here’s a visual summary of the benefits before we break them down:

In the US, 25% of brands delivered a worse customer experience in 2025 than they did in 2024. Only 7% of brands improved the customer experience, according to Forrester.
Meaning, companies still struggle to improve customer experience. This highlights why customer experience analytics matters.
Customer experience analytics helps identify churn risk. For example, a customer may start using your product less or leave a negative review.
With these actionable insights, your team can reach out with personalized support before customers churn. This helps increase customer loyalty, which improves retention in the long run. In fact, PwC found that 29% of customers left a brand because of a poor customer experience in 2025.
Product-market fit means that your product satisfies the demand of your target audience. Customer experience analytics helps you understand where customers struggle when using your product.
For example, customers might repeatedly complain about one feature or a drop-off at one onboarding step. Improving your product based on these insights helps customers get their first meaningful outcome faster. This increases retention.
CLV is the total amount of revenue a customer generates over time. Customer experience analytics helps you understand which experiences keep customers coming back.
For example, customers who receive fast support may be more likely to renew or buy again. Your team can then improve those experiences for all customers. This helps increase repeat purchases, loyalty, and long-term revenue.
Feedback from support tickets, surveys, and emails can reveal recurring issues. For example, 50 customers may complain about the billing process being too complicated.
Your team can fix the root cause, which reduces repeat requests. This way, support agents can focus on more complex issues.
This means building a company culture focused on customers. Product, support, and marketing teams make decisions based on customer needs.
For example, you can develop product features that customers request. Your support team should also send personalized responses. This helps you deliver a better customer experience.
Customer experience analytics helps you improve retention and decrease churn. This is because you can analyze customer feedback, behavior, and support interactions. Then, you can act on these insights before customers switch to competitors.
It also helps improve products, increase CLV, reduce support costs, and build a customer-focused culture.
Also Read:
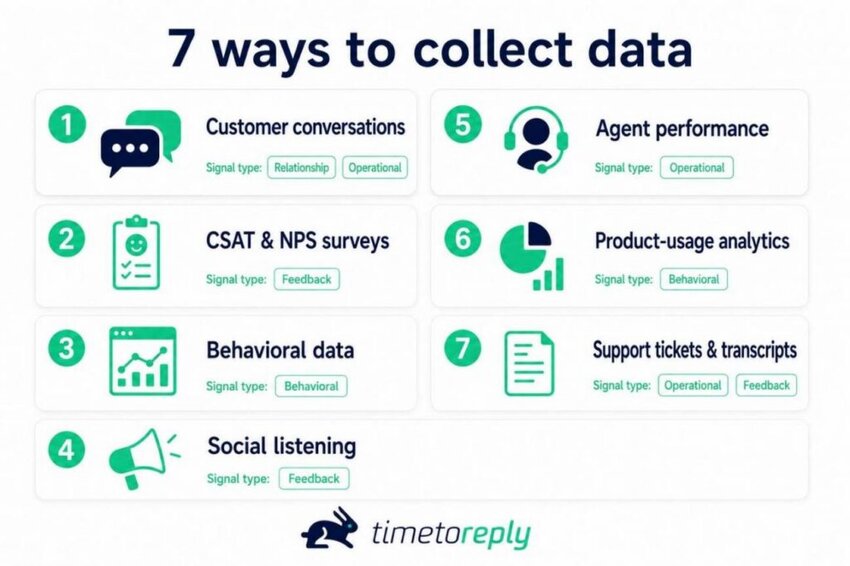
Collect data from custom conversations, Customer Satisfaction (CSAT) and Net Promoter Score (NPS) surveys, and behavioral data. You can also get data from social listening, support agent performance, product usage, and support tickets.
Here’s a quick breakdown of the seven ways to collect data for customer experience analytics, including the signal type:
Always collect customer data from multiple sources. This gives you a complete view of the customer experience. You should also use feedback tools to unify customer data from different channels. 74% of customers get frustrated with having to repeat themselves, according to Zendesk (2026).
This data lives in support threads, emails, and live chats. These conversations include customer sentiment, intent, and urgency.
You don’t have to wait for survey data. Analyzing conversations is one of the fastest ways to get started with customer experience analytics because the data already exists.
CSAT surveys measure satisfaction after an interaction. For example, a CSAT survey question can be, “How satisfied are you with today’s support experience?”
NPS surveys ask how likely customers are to recommend your brand. For example, “On a scale of zero to ten, how likely are you to recommend us to a friend?”
Behavioral data is information from specific customer actions. This includes product usage, website visits, clicks, and purchases. It also reveals which features customers struggle with when using your product.
This means monitoring what customers say about your brand on social media, forums, blogs, and review sites. Customers share opinions about your product, such as whether it’s easy to set up and use.
They can also mention how fast your customer service agents resolve issues. This is useful for spotting reputation risks early.
Track customer service metrics for each agent, including response time and resolution rate. You will see which agents consistently deliver strong support. You can also spot which agents may benefit from extra coaching.
Product usage data tells you whether customers get value from your product. For example, whether they closed their first deal after using your product.
This data helps product teams spot churn risks early. It also helps identify engaged customers who may be ready to upgrade their plan.
Every support ticket is a record of a problem and how that problem was resolved. Always analyze support tickets and transcripts of previous cases. They reveal recurring issues, root causes, and gaps in your customer knowledge base.
Start with data you already own, such as customer conversations, support tickets, and product usage data.
Then, send CSAT and NPS surveys and track behavioral data. Collect data through social listening and support agent performance.
Also Read:
The eight CX metrics we recommend you should track include NPS, CSAT, CES, and churn rate. You should also measure retention rate, resolution time, product engagement, and CLV.
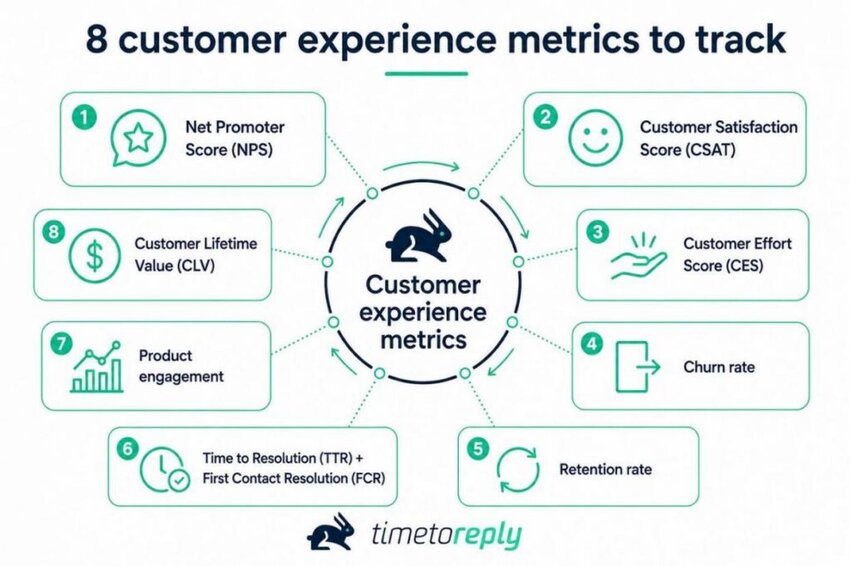
Here’s a short list of the CX metrics:
These metrics are either leading or lagging indicators. Leading indicators are predictive metrics. For example, a high effort score can signal churn risk. Lagging indicators are historical metrics that track whether past strategies were successful.
Here’s a quick breakdown:
| Metric | What it measures | Leading or lagging? |
| NPS | Overall loyalty | Lagging |
| CSAT | Satisfaction after an interaction | Leading or lagging |
| CES | Effort to get a result | Leading |
| Churn rate | Customers lost | Lagging |
| Retention rate | Customers kept | Lagging |
| TTR and FCR | Speed and first-try resolution | Leading |
| Product engagement | Active, deep usage | Leading |
| CLV | Revenue per relationship | Lagging |
NPS measures loyalty by asking customers whether they would recommend your business to others. Promoters score nine to 10, and passives score seven to eight. Detractors score zero to six, according to Bain:
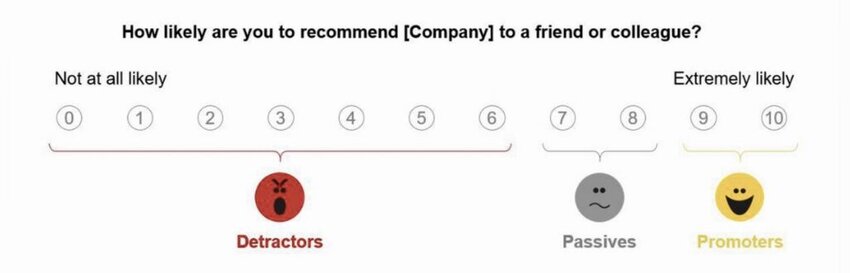
Image via Bain
This shows how satisfied customers are with a specific interaction, product, or service.
For example, send a survey asking customers to rate their experience after a support chat. Low scores indicate that you need to improve customer service.
CES measures how easy or hard it was for customers to complete a task. This can include returning a product or resetting a password.
After the interaction, send a short survey that says, “It was easy to resolve my issue.” Customers can rate it from “strongly disagree” to “strongly agree.”
Customer churn rate measures how many customers leave during a period, such as a month. Consider grouping customers by when they signed up. For example, monitor churn rate of customers who signed up in January vs March.
This shows which group churns faster. Learn how to perform customer churn analysis to understand why they leave.
This measures how many customers you keep over time. If customers renew their subscriptions every year, your retention rate remains high or increases.
If customers stop renewing their subscriptions, they may not be getting enough value from your product. Improve your features or offer personalized support to increase customer retention.
TTR is the total time from when a customer submits a support ticket to when it’s resolved. FCR is the percentage of tickets resolved on the first interaction.
Customers ranked FCR as the most valued aspect of service interactions. Yet, only 32% of businesses tracked FCR in 2025, according to Genesys.
Product engagement metrics show how often customers use your product. For example, the number of times they log in each week or use key features. Spotting low customer engagement early can help you reduce churn.
This estimates how much revenue one customer generates over time. For example, a customer who renews every year has a higher CLV than someone who buys once. A rising CLV means higher revenue without the need to acquire new customers all the time.
For customer experience analytics, you need to track metrics such as NPS, CSAT, CES, churn rate, and retention rate. Don’t forget to measure TTR, FCR, product engagement, and CLV.
These metrics help you spot customers who are about to leave and understand why they leave. They also help you measure whether your product or customer service improvements are working.
Also Read:
With customer experience analytics, you can spot churn risk and act early. You can segment your customers and personalize onboarding. You can also close the feedback loop faster and improve self-service.
Here are the strategies at a glance:
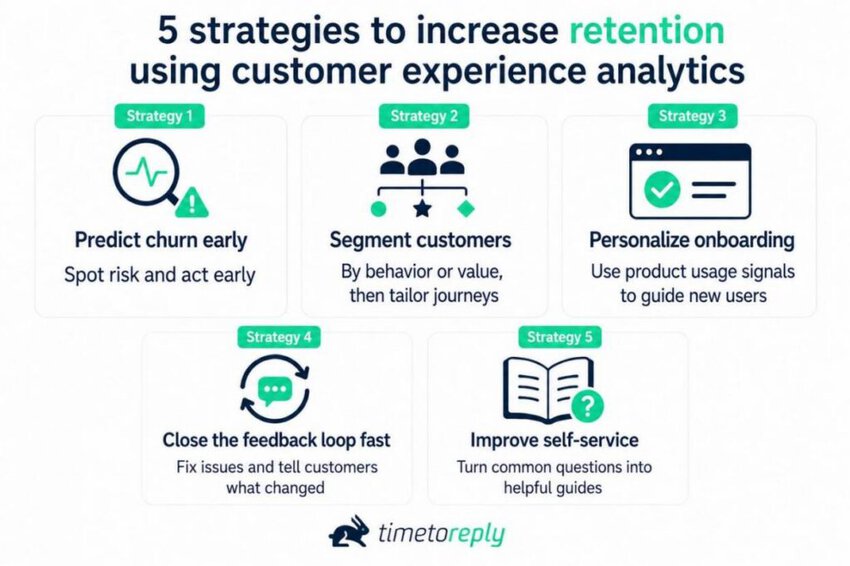
A churn model predicts which customers are likely to leave. For example:
AI and churn prediction software can flag these warning signs. But your team should review the results before taking action. Then offer the right support, such as a training session, before the customer leaves.
The data you collect for customer experience analytics can help you segment customers. For example:
You can then tailor the experience. Provide new customers with more guidance or offer loyal customers rewards.
This means you personalize a new user’s onboarding based on how they interact with your product. Customer experience analytics helps you track which features customers use the most and where they get stuck.
For example, if a customer signs up but never creates their first project, send a short setup guide. This prevents early drop-offs.
Act on customer feedback as soon as possible and update customers on what changed. For example, if several customers report that the checkout page is confusing, simplify it quickly. Then email them to explain that the update was based on their feedback.
Customer experience analytics helps you understand which questions customers ask most. For example, “How do I reset my password?”
Turn these common questions into help articles and in-app guidance. This way, customers don’t always have to contact support to resolve an issue.
Customer experience analytics helps you collect signals, such as product usage, feedback, support interactions, and customer behavior.
You can then build churn models to spot at-risk customers early, segment customers and tailor journeys, and personalize onboarding. You can also close the feedback loop faster and improve self-service.
Also Read:
1. What is customer experience analytics?
Customer experience analytics is the process of collecting and analyzing data from customer interactions. It combines relationship signals, like sentiment, and operational signals, like reply times.
2. Is there a difference between customer journey analytics and customer experience analytics?
Yes. Customer journey analytics tracks the steps a customer takes, from discovering your business to making their first purchase.
Customer experience analytics goes further. It helps you evaluate the experience across customer interactions. These can include website visits, product usage, or support conversations.
3. What is the difference between CX analytics and customer service analytics?
Data for customer experience analytics comes from all types of customer interactions. These include website visits, purchase history, or product usage.
Customer service analytics is only focused on support interactions. It includes data such as response time and agent performance.
4. What data sources are used in customer experience analytics?
Common sources include direct feedback from CSAT and NPS surveys. They also include behavioral data, product usage, social listening, and support conversations.
5. What are the most important customer experience metrics?
The core customer experience metrics include NPS, CSAT, CES, churn rate, and retention rate. Businesses also measure first contact resolution, response time, and CLV.
6. How do you measure customer experience with analytics?
Track operational signals, like reply time and resolution rate, and relationship signals, like sentiment and intent. Set clear benchmarks for each. Then track them over weeks or months to observe trends.
7. How often should you measure NPS and CSAT?
Measure CSAT immediately by sending customers a survey after an interaction, such as a support conversation. Ask how satisfied they were with the customer service.
You can send NPS surveys quarterly. Ask customers if they would recommend your brand to others.
8. Which data sources should you prioritize first?
Start with data you already own. Your email and support conversations already include customer sentiment, intent, and urgency. You can analyze them right away, without needing to send surveys.
9. Do you need a Voice of the Customer (VoC) program for customer experience analytics?
Not really. A VoC program helps you collect customer feedback through surveys, reviews, and interviews. But you can get started with customer experience analytics without it. You can collect data from support tickets or product usage and include VoC later.
10. How does customer experience analytics reduce churn?
Customer experience analytics helps you spot early warning signs, such as reduced product usage or negative feedback. You can then improve your product features or offer personalized support to reduce churn.
Also Read:
Customer experience analytics is the process of collecting and analyzing data from customer interactions. It combines customer behavioral, operational, and feedback data to uncover recurring problems. This helps you act early to reduce customer churn.
When starting with customer experience analysis, gather data you already own. This includes live chats, support tickets, and email conversations that show you sentiment or urgency.
Use tools like timetoreply that integrate with your mailbox. It has an intelligence layer that identifies sentiment, intent, and urgency in real time.
This helps you improve the customer experience and increase retention. Book a demo to see your customer experience signals in one place.
Get live inbox alerts and reply quickly to customer emails with timetoreply

Head of Customer Success @ timetoreply
Barry Blassoples is the Head of Customer Success at timetoreply, where he helps customer-facing teams boost revenue and protect brand reputation by providing actionable insights to improve their business email response times. He has over 15 years of leadership experience across customer success, sales, and marketing roles in high-growth tech companies.



Trusted by high-performing inbound sales teams and customer-facing teams globally.
Close more deals and delight more customers with the faster, smarter, deeper email analytics and performance optimization software that works straight from your team’s inbox.