
Customer service analytics involves analyzing data from customer interactions to improve the customer experience. Customer-facing teams use customer service analytics to track response times, customer satisfaction, ticket resolution, and team performance across support channels.
Tracking the right customer service analytics metric lets businesses identify service gaps, reduce customer churn, and improve operational efficiency. The insights also help teams make informed decisions and deliver consistent customer support.
In this guide. You’ll learn the main types of customer service analytics and the key metrics to track. You’ll also know how customer service analytics tools help support and sales teams improve performance.
Also Read:
The four main types of customer service analytics are descriptive, diagnostic, predictive, and prescriptive analytics. They help customer-facing teams understand past performance, identify issues, and predict customer behavior.
To better understand customer service analytics, we must first know how each type works and the role it plays in improving customer experience.
Descriptive analytics helps teams understand what has already happened in customer support operations. It analyzes historical data such as ticket volume, average email response time, and customer satisfaction scores.
For instance, it can reveal trends in customer complaints over the past year or highlight the most common issues.
Predictive analytics uses historical customer data to forecast future customer behavior and business outcomes. It helps your team anticipate issues before they happen.
For example, it can predict customer churn based on declining engagement or repeated complaints. Your team can then take proactive steps to improve customer retention and customer satisfaction.
Prescriptive analytics recommends specific actions businesses should take based on customer data and predicted outcomes. It helps you make faster and more informed decisions.
Assuming customer service analytics show delayed email responses and lower CSAT scores. Prescriptive analytics can suggest improving workflow or increasing staffing during peak periods.
Diagnostic analytics helps you understand why a problem happened. It examines patterns and identifies root causes behind customer service issues or low performance.
For example, if customer satisfaction suddenly drops, diagnostic analytics can identify whether it was due to a product defect or poor customer service. This allows your team to fix problems effectively.
Customer service analytics metrics help teams measure customer satisfaction and retention, response efficiency, and support performance. Tracking these metrics gives you a complete picture of customer perception and operational reality.
Below are ten customer service analytics metrics you should monitor.
CSAT measures customers’ satisfaction with a specific interaction, service, or overall experience with your business.
Customer service analytics teams measure CSAT by asking customers to rate their experience on a scale such as 1 to 4, with 1 being poor and 4 being excellent. A common question is: “How satisfied are you with your experience today?”
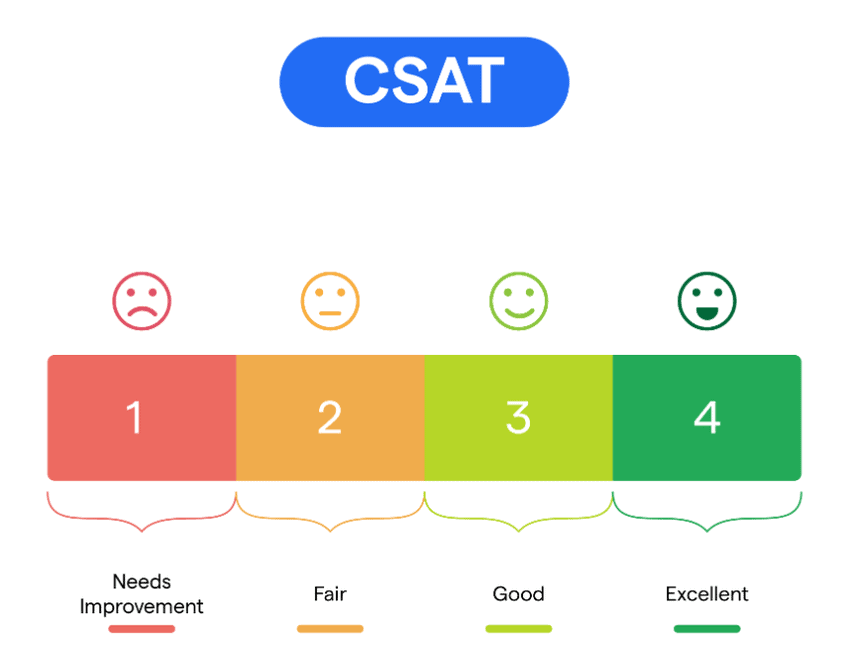
Image via Bot Penguin
You can calculate CSAT using the following formula:
CSAT = Sum of Positive Responses / Total Responses * 100
With this information, you can identify whether customers are happy with the support they receive.
Send CSAT surveys once you close a support ticket. Track scores against customer service agent, channel, and ticket type. This way, you can see where the customer experience breaks down.
NPS measures how likely customers are to recommend your company, product, or service to others. This customer service analytics metric helps you understand customer loyalty and long-term satisfaction.
A typical NPS question asks: “On a scale of 0 to 10, how likely are you to recommend our company to a friend?”
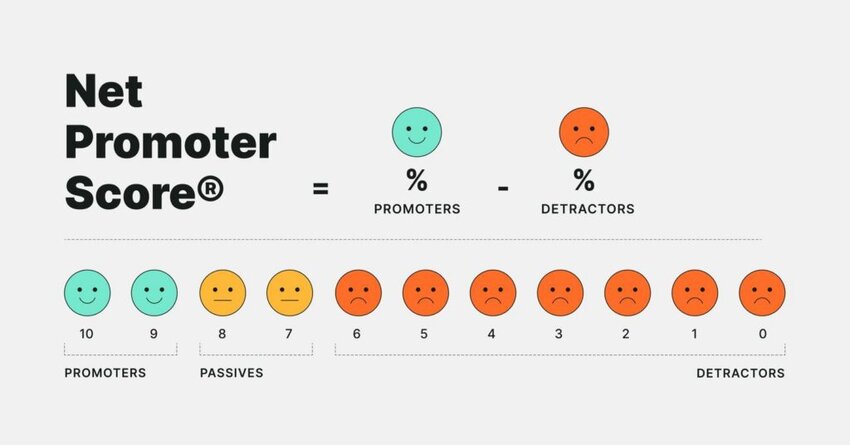
Image via mTab
Customers who score 9–10 are Promoters. Those who score 0–6 are Detractors. Scores of 7–8 are Passives and are excluded from the calculation.
You can calculate your NPS using a simple formula:
NPS = (% of Promoters) – (% of Detractors)
A low NPS may indicate customer dissatisfaction, service issues, or a problem with a product. Run NPS surveys at key moments in the customer journey, such as 30 days after onboarding. This strategy provides feedback before customers start complaining or leave for a competitor.
Also Read:
A Customer Effort Score (CES) measures how much effort a customer had to put in to get their problem solved. Teams should track this customer service analytics metric because ease of resolution predicts customer loyalty.
A typical CES question is “How easy was it to resolve your issue?” Answers should be provided on a scale of 1-5, with one being high effort and five being low effort.
Once you have a suitable number of responses, you can use the following formula to calculate your CES:
CES = Total CES scores/ Total responses
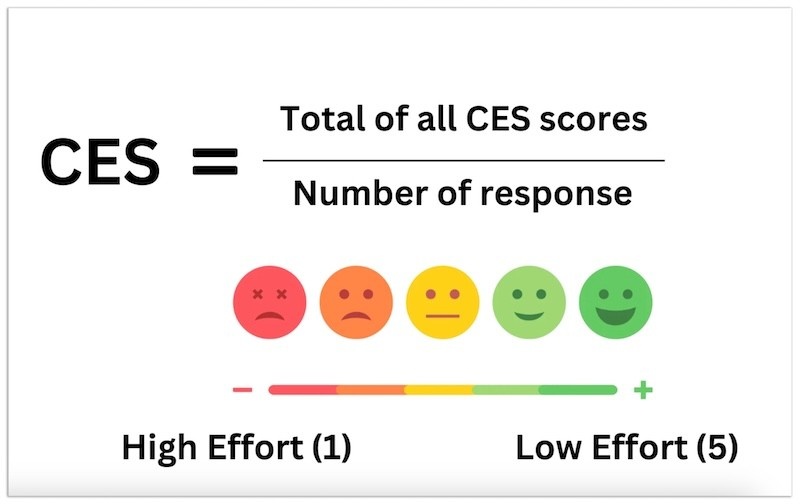
Image via Eclipse AI
A high score indicates less effort, which often leads to higher customer satisfaction and better retention. If you leave customer service queries unanswered or neglected for too long, the score will be low.
By having a CES benchmark, companies can identify problem areas and implement appropriate corrective measures.
CLV predicts the total value a business can expect from a single customer over the duration of the relationship. It helps teams understand how support quality affects customer retention and revenue.
A common CLV formula is:
CLV = Average purchase value x Purchase frequency x Customer lifespan
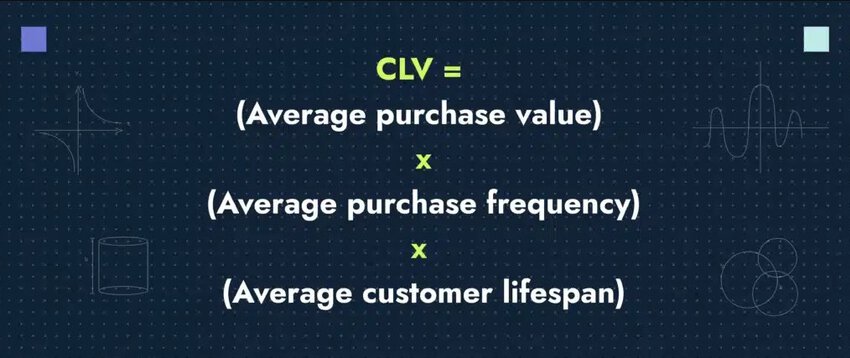
Image via Productive Shop
Customers who receive fast, effective support spend more and stay longer. Improving response quality, personalization, and customer satisfaction can increase CLV over time.
First contact resolution tracks the percentage of customer inquiries resolved during the first interaction. It’s one of the customer service analytics metrics that measure team effectiveness and customer effort simultaneously.
When customers have to come back a second time for the same issue, it affects customer satisfaction and trust.
You can calculate FCR using this formula:
FCR = (Total resolved cases on first contact / Total cases handled) x 100
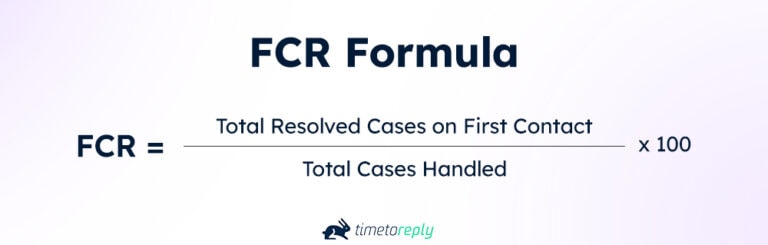
Image via timetoreply
High FCR rates often lead to higher customer satisfaction. Track FCR by ticket type and agent, and use the data to create better self-service resources or staff training guides.
CRR is a customer service analytics metric that measures the percentage of customers a business keeps over a specific period. It’s a long-term signal that your service quality is working.
The formula for calculating CRR is:
CRR = ((Customers at the end of a period – New customers gained) / Customers at the start of the period) X 100
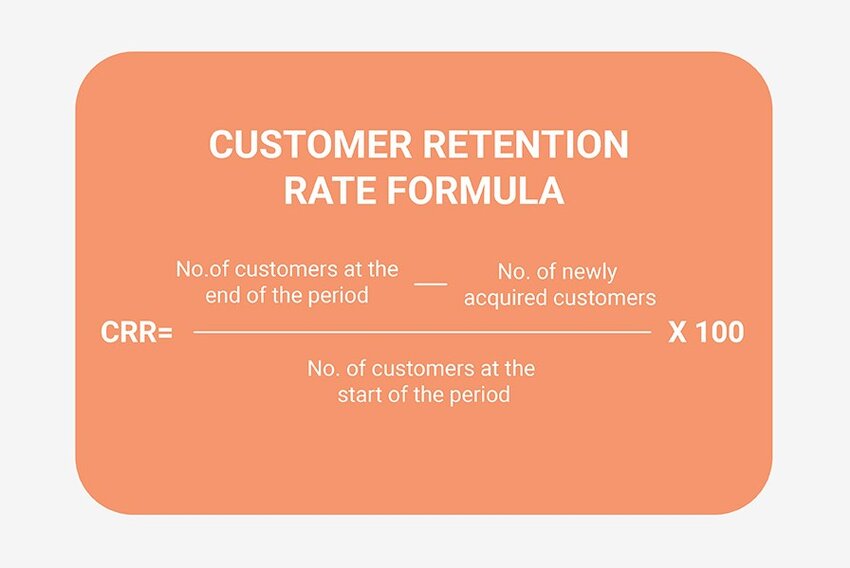
Image via Sixsentix
Higher retention rates mean customers are getting enough value to stay. Segment retention rate data by customer tier or product line to identify which groups are at higher risk.
This customer service analytics metric calculates the rate at which customers stop doing business with a company. It’s the inverse of customer retention and deserves attention when it starts climbing.
Churn rate is calculated using this formula:
Churn rate = (Customers lost in a period / Customers at the start of the period) x 100
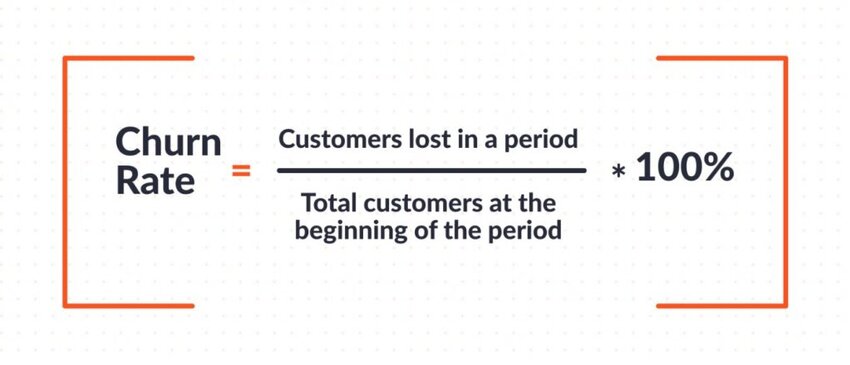
Image via Reteno
Lower churn rates are better, as they indicate customer loyalty. A rising churn rate indicates issues, such as slow replies, unresolved complaints, or poor customer experiences.
You should pair customer churn analysis with metrics like CSAT and CES. They show specific reasons why customers may be leaving.
Average ticket resolution time measures how long it takes customer service teams to successfully close a support ticket. Teams use tools like timetoreply to monitor this customer service analytics metric, which offers insight into team performance.
Once you have that data, you can use a simple formula to calculate your average ticket resolution time:
Average Ticket Resolution Time = Total time to resolve all tickets / Total number of tickets resolved.
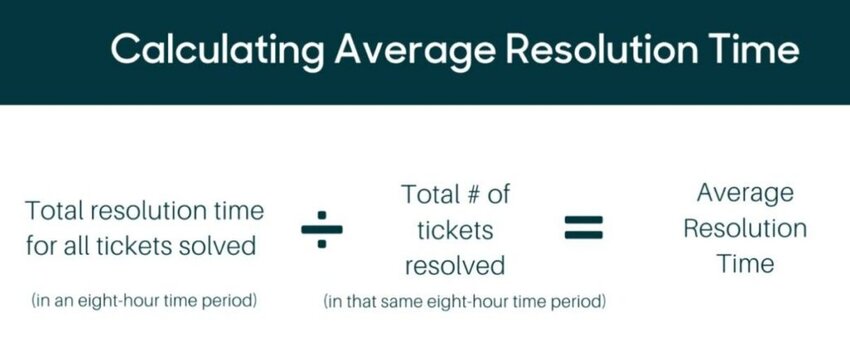
Image via Sentisum
You can use this customer service analytics metric at both the team and individual levels. It helps managers identify workload imbalances and improve support workflows.
Want to lower your average ticket resolution time? Consider implementing a standard email reply time policy and using a tool such as timetoreply to track customer service emails and the time it takes to resolve the issue.
Also Read:
This customer service analytics metric tracks how long your customer service team takes to send the first reply to a customer’s request. It’s closely aligned with Average Ticket Resolution Time and checks your team’s responsiveness and resolution speed.
You can calculate your average time to first reply manually by using the formula:
Average Time to First Reply = Total time of first replies / Number of queries replied to
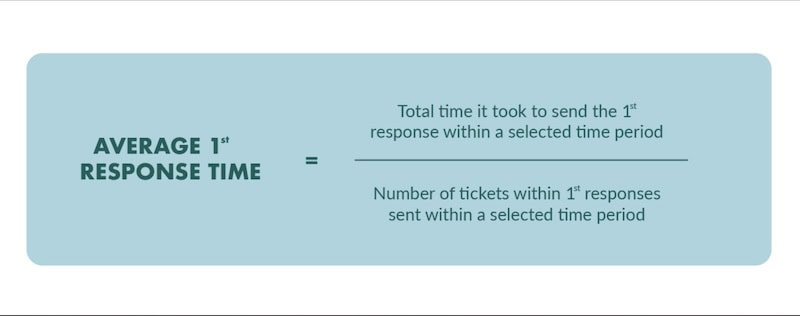
Image via Superoffice
Measuring and improving this metric is essential to building a winning customer service team. You don’t necessarily need to resolve the customer’s issue in your first reply.
A quick acknowledgment tells the customer you’re attending to their problem. It puts them at ease that you’re not about to ignore your loyal customers or their concerns.
Average time to reply is a vital customer service analytics metric that measures how long teams take to reply to all incoming emails. The messages can be first-time queries or part of an ongoing conversation.
This builds on Average Time to First Reply by ensuring every email that customers send to your business is addressed. It also shows that your customer service teams remain responsive.
If your first time to reply is quick, but you take more time to respond to subsequent queries, you’ll still end up with unhappy, dissatisfied customers. And you’ll have to face the likelihood that you’ll lose those customers to more responsive competitors.
Improving your average time to reply holds several benefits. It helps you understand how well your customer service teams are doing in meeting the KPIs you’ve set.
For example, you’ll want to know that your teams and customer service agents can respond to incoming emails within 30 minutes, at least during office hours.
By tracking your average time to reply on group mailboxes, you’ll also be able to identify problem areas and bottlenecks that negatively impact your reply times.
You can calculate your time to reply by using the formula:
Average Time to Reply = Total sum of time to reply to all emails / Total emails replied to
However, instead of manually measuring this important customer service analytics metric, you can use email response time-tracking software like timetoreply.
Once installed on your email platform of choice, timetoreply provides a dashboard that lets you view all your important customer service and email metrics at a glance.
It also allows customer service teams and managers to easily track the average Time to Reply, the average First Time to Reply, and other metrics.
Customer service analytics metrics help customer-facing teams measure satisfaction, responsiveness, efficiency, and retention. Tracking the right metrics makes it easier to improve service quality and deliver better customer experiences.
Customer service email software helps teams track responses, manage workloads, monitor SLAs, and improve customer communication. It also gives you better visibility into customer service analytics, making it easier to identify delays, missed emails, and performance gaps.
Email is a weak spot for companies if they lack visibility into their teams’ performance. This will lead to lower customer satisfaction and increased customer churn, which can affect your revenue.
Using customer service email management software will provide the much-needed support for managing your customer service teams and agents. It also offers several benefits, which we’ll discuss in this section.
Customer service email software helps managers distribute workloads across teams.
Using customer service analytics data, they gain visibility into peak email traffic times, individual workloads, average email response times, and average first reply times.
As a result, businesses can improve resource planning and identify where team members need more training and support.
With customer service email tools, teams can track incoming emails and prevent important messages from being overlooked.
Despite your team’s best efforts, there’s always a chance that an important email goes amiss. This can lead to unhappy customers and lower levels of customer satisfaction.
Customer service email analytics tools, such as timetoreply, provide reminders when emails are approaching the SLA threshold. This way, you’ll never miss an important email again.
Using customer service email software equips you with accurate data on your team’s email performance. With this insight, you can develop strategies for timely and effective replies to customer queries.
These strategies can include workflow improvement, organizing staff training, and delivering consistent customer support across channels.
Customer service email software helps teams maintain SLA performance and respond to customers more efficiently. When combined with customer service analytics, it becomes easier to improve support operations and customer experience.
Also Read:
Customer service analytics applies across every stage of the customer journey, from first support interaction to long-term retention. Here are some key use cases based on comprehensive data analytics:
Customer service analytics helps teams assess customer feedback from surveys, emails, chats, and support tickets. This makes it easy to identify recurring complaints, product issues, or areas where customers expect better service.
Customer service analytics enable businesses to identify the most frequently used support channels and common questions. With this data, managers can invest more resources in the right channels. They can also create knowledge bases to reduce the number of times customers contact support teams.
Detailed customer service analytics help monitor and improve support team performance. Metrics such as average response time, ticket volume, and customer satisfaction scores are tracked to ensure team members perform at their best. It also helps identify areas for improvement.
Advanced AI and machine learning tools can help teams quickly identify urgent tickets and high-priority customer issues. This helps businesses respond faster to critical issues and improve overall support efficiency.
Data-driven insights from customer service analytics can guide the development of self-service options. These include FAQ sections, chatbots, and other digital aids that empower customers to find solutions independently. It leads to quicker resolutions and enhanced customer satisfaction.
With customer service analytics, businesses can understand customer behaviors and preferences. This way, they can tailor their interactions and services to meet individual needs, enhancing the overall customer experience and boosting loyalty.
Customer service analytics provides feedback to improve services and products. These insights also help businesses deliver more efficient and personalized customer experiences.
The customer service analytics landscape is quickly changing due to significant advancements in technology. Here’s what you can expect shortly:
AI and machine learning are set to transform customer service analytics by automating responses and providing real-time insights. Companies will leverage AI to handle the vast majority of customer interactions, significantly reducing the need for human intervention in standard queries.
Self-service options will continue to grow, as customers increasingly prefer to resolve issues independently. Tools like AI chatbots will become more sophisticated, offering more accurate and helpful responses, leading to a rise in customer satisfaction and operational efficiency.
Predictive analytics will play a crucial role in personalizing customer interactions. By analyzing past behavior, businesses can predict future needs and tailor their communications accordingly. This approach will not only improve customer satisfaction but also enhance loyalty and retention.
The focus will shift towards seamless integration of multiple service channels to deliver a unified customer experience. Businesses will strive to ensure that interactions are consistent across all platforms, enhancing the overall customer journey analytics.
Businesses will move from reactive to proactive service models. Advanced customer service analytics will enable companies to anticipate customer issues and address them before the customer reaches out. This proactive approach is expected to reduce customer effort and increase satisfaction.
Conversational interfaces, such as voice and chatbots, will become more refined, making interactions more natural and efficient. These tools will be capable of handling complex customer needs, thereby reducing the dependency on human agents for such issues.
With increasing scrutiny on data usage and privacy, companies will need to prioritize transparent and ethical use of customer data. This will involve implementing robust data protection measures and ensuring compliance with global data privacy regulations.
Also Read:
1. How are analytics used in customer service?
Customer service analytics help businesses figure out what’s working and what’s not by looking at real data from conversations, tickets, feedback, and more.
This could mean tracking how long it takes to resolve issues, spotting repeat problems, or seeing which agents are knocking it out of the park.
Instead of guessing what customers are feeling or needing, teams use actual numbers and patterns to make smarter choices.
2. What are the 4 main categories of customer analytics?
The four main types of customer service analytics are descriptive, diagnostic, predictive, and prescriptive. Descriptive tells you what’s already happened, like how many support tickets came in last month.
Diagnostic looks into why something happened, maybe revealing that response times went up because staffing was low.
Predictive tries to guess what might happen next. For example, it can suggest which customers might churn based on how often they’ve contacted support.
Prescriptive takes it a step further and recommends what to do about it, like offering proactive outreach.
3. What is customer service analysis?
Customer service analysis is the process of reviewing service interactions, data, and feedback to see how well a support team is performing.
It’s about asking questions like: Are we solving issues fast enough? Are customers leaving satisfied? Are we seeing the same problems over and over again?
This type of data analysis makes it easier to measure success and improve the experience.
4. What does a customer service data analyst do?
A customer service data analyst spends their time sorting through support data to figure out what it’s saying. They pull numbers from emails, chats, calls, and surveys, and turn them into something the team can actually use.
Maybe that means finding the most common complaint or figuring out which hours are busiest—either way, they’re helping teams make smart calls based on facts, not hunches.
5. What are the key elements of customer analysis?
Customer analysis usually focuses on a few main areas: who your customers are, what they want, how they behave, and how they feel about your brand or service.
It starts with basic data like demographics, but goes deeper into things like purchase history, service usage, and how often they reach out for help.
Companies have access to several customer service analytics tools to help them understand the success or otherwise of their customer service teams. Tools such as Net Promoter Score, Customer Satisfaction Score, Customer Effort Score, and Average Time to Reply will give customer service teams insight into where their efforts are succeeding and where they can still improve.
While there are manual ways to track and measure many of the metrics available to customer service teams, companies can also use technology tools to automate some of this work. This frees up precious internal resources while ensuring full visibility over important customer service metrics.
timetoreply is an invaluable customer service analytics tool for customer service teams seeking higher levels of customer satisfaction. Our platform easily integrates with any email service and delivers valuable insights into the performance of customer service teams.
You can see what timetoreply can do for your customer service teams with a no-obligation 15-day free trial. Get in touch today to unlock the next level of customer satisfaction success with the best customer service email analytics tool.
Get live inbox alerts and reply quickly to customer emails with timetoreply

Head of Customer Success @ timetoreply
Barry Blassoples is the Head of Customer Success at timetoreply, where he helps customer-facing teams boost revenue and protect brand reputation by providing actionable insights to improve their business email response times. He has over 15 years of leadership experience across customer success, sales, and marketing roles in high-growth tech companies.


Trusted by high-performing inbound sales teams and customer-facing teams globally.
Close more deals and delight more customers with the faster, smarter, deeper email analytics and performance optimization software that works straight from your team’s inbox.