
Customer success metrics show how customers use your product, how satisfied they are, and when they may be at risk of churning. To get the full picture, track key areas, such as customer satisfaction, retention, churn, and lifetime value.
Tracking these metrics can help you spot early signs of frustration before it leads to churn. When you use these numbers to create positive customer experiences, you can build customer loyalty and increase revenue over the long term.
In fact, early-stage SaaS companies can experience churn as high as 5.7% per month due to an understaffed support team. According to Focus Digital, hiring dedicated customer success managers drops churn to 3.9%:
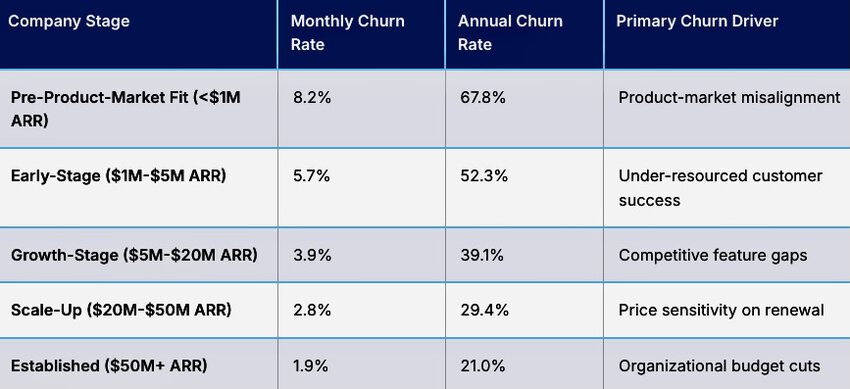
Image via Focus Digital
In this article, we’ll cover 15 key customer success metrics to track. Reduce churn, improve retention, and increase long-term customer value.
Customer success metrics measure how well a business helps customers get value from its product. They show customer satisfaction, usage, and retention. This gives you an idea of whether users are staying active or showing early signs of churn.
These insights help you improve customer experience and long-term customer value. Here are more reasons why you should track customer success metrics:
Also Read:
Customer success metrics measure how effectively a business helps customers get value from a product or service. Track key indicators like satisfaction, usage, and retention. These metrics help teams spot friction early, improve collaboration, and drive long-term revenue growth.
Here are the top 15 customer success metrics that your business should start tracking today.
This measures how easy or difficult it is for a customer to resolve an issue or get help.
It’s one of the most important customer success metrics because low-effort customer interactions lead to higher satisfaction and loyalty. Meanwhile, when customers have to put in too much effort to interact with your brand, they might switch to competitors.
You can collect and measure CES through a post-interaction survey that asks customers to rate the ease of the experience on a scale. For example, “On a scale of one to five, how easy was it to have your issue resolved?”
You can also use agreement scales like “strongly agree” to “strongly disagree.” The responses are then averaged into a final score.

Image via Zonka
If you have a high CES, you can reduce it by guiding customers through onboarding steps, such as account setup and first-time feature use. You can also simplify support requests and issue resolution. Lastly, you can offer self-service options, such as help articles or FAQs.
First contact resolution rate measures the percentage of customer support inquiries your team resolves in the first interaction. This is when they don’t need follow-up messages or additional contact.
It’s among the top customer success metrics to track because it shows how efficiently your support team can meet customer needs and improve customer experience. When issues are resolved on the first contact, customers are more satisfied.
As a result, they’re more likely to stay with your brand.
On the contrary, if they keep contacting you for the same issue, they could become frustrated. This can also increase the workload for support teams.
To improve FCR, customer-facing teams need adequate training. They should have access to the right knowledge bases so they can respond to customers without escalating to another agent.
Before calculating FCR, you need to clearly define what counts as a “resolved ticket.” For example, this could be when the customer confirms that their issue is resolved or that no further follow-up is needed. This maintains a consistent FCR score.
To calculate your first contact resolution rate, divide the number of cases resolved in the first contact by the total number of cases handled. Then, multiply the result by 100:
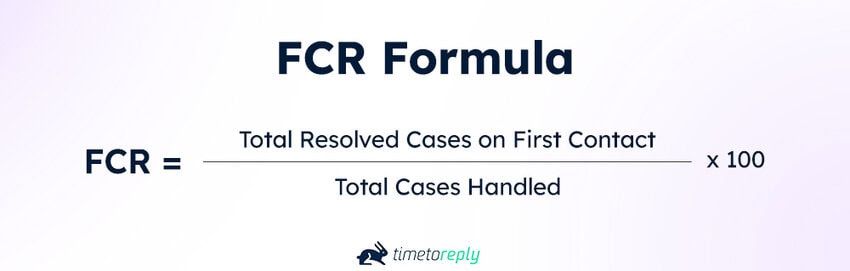
Image via timetoreply
You can track your FCR for various support channels, including email, live chat, or phone. This helps you see where issues are resolved quickly and where customers experience delayed responses.
A low FCR signals that agents need better training or deeper product knowledge to resolve issues on the first try.
Also, if you communicate through email, you can invest in an email analytics tool like timetoreply that offers live inbox alerts. This can help you assign customers to the most competent and available support agent.
Also Read:
Customer satisfaction score measures a customer’s immediate satisfaction with a service, product, or support received. It acts like a “report card” that gives you a quick rating of how happy or unhappy a customer was after an experience.
It’s one of the most important customer success metrics that shows how effectively your customer-facing teams can resolve issues.
Measuring CSAT matters because it helps identify churn risks. For example, low scores pinpoint unhappy customers before they leave. This gives you a chance to fix their issues early and improve retention.
Like most customer success metrics, it helps you understand which parts of the customer experience are working well or causing frustration. This includes checkout, delivery, or customer support interactions.
You can track your customer satisfaction score by sending a short survey after a purchase or support interaction. Customers will rate their satisfaction on a simple scale, such as one to five.
Calculate the score by dividing the number of positive responses by the total number of responses. Then, multiply by 100:

Image via AraHoster
Customer success teams can use CSAT alongside qualitative customer feedback to understand not just the score, but the reasons behind it.
A high CSAT score indicates satisfied customers. Meanwhile, a low or declining score signals issues in the customer experience. They could be confused when using products or their issues remain unresolved.
To boost CSAT, teams can improve their FCR, personalize support, and send follow-up emails after resolving customer issues.
Time to value (TTV) measures how long it takes a new customer to realize the promised value of your product after signing up.
Why is it among the most critical customer success metrics to track? When customers see the value of your product right away, they’re less likely to churn. A low TTV can also boost customer loyalty.
If it’s taking a long time for customers to see how your product helps them, they can stop using it and even request a refund. Dissatisfied customers might even leave negative feedback on social media.
Before tracking TTV, you must define what “value” means for your customers. This could be completing onboarding or achieving a specific outcome. Measure the time from the moment a customer signs up or makes a purchase until that milestone is reached.
You can monitor this in your customer success metrics dashboard inside your CRM or email analytics tool. You’ll see this along with your customer health score and renewal rate.
This way, you can identify accounts that need extra attention. This includes customers who show signs of churn risk or usage friction — for example, low product usage or low CSAT.
To improve TTV, you should help customers achieve the results they want from using your product or service. Improve onboarding support by offering training sessions and providing how-to videos and FAQs.
You should also ensure quick responses to customer queries so customers don’t get stuck early on.
Also Read:
A customer health score shows how “healthy” a customer relationship is. This signals whether a customer is happy and likely to keep using your product, or struggling and at risk of leaving.
It aggregates customer success KPIs like product usage, renewal history, customer satisfaction score, and your average email response time.
Measuring customer health score matters because it serves as an early warning system. It helps predict if a customer will renew subscriptions or not.
A high score also indicates that customers are more likely to stay engaged and potentially switch to higher product tiers.
Unlike other customer success metrics, there’s no specific formula for measuring customer health score. You must define which KPIs matter most to your business. SaaS companies, for example, consider metrics like:
Assign a score to each metric based on its impact on the overall customer health score. You can then track the combined result in a customer success dashboard. Use indicators like color labels to identify healthy, at-risk, or disengaged customers:
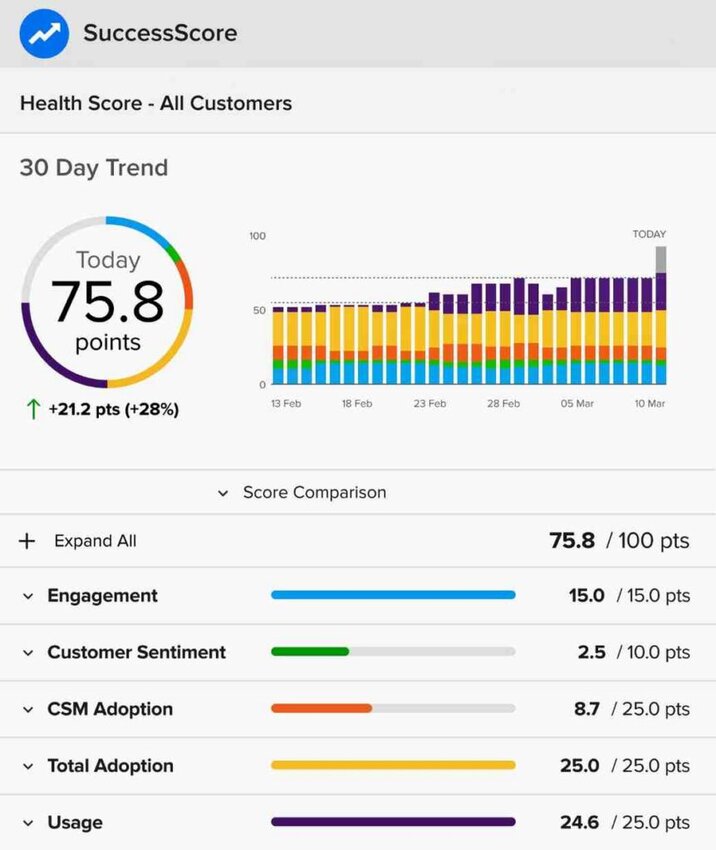
Image via clientsuccess
A declining customer health score signals that customers may not be getting enough value from the product. They could be at risk of canceling their subscription.
To improve your score, identify the cause of the decline. Then, address the issue through regular check-ins, product demos, or faster customer support.
Net promoter score is one of the key customer success metrics, measuring how likely customers are to recommend your product or service to others.
A high score indicates that your customers are satisfied and are likely to advocate for your brand. This word-of-mouth marketing will bring in new customers organically.
And if you’re lucky enough to have a social media influencer in this category, there’s a high chance of reaching a wider audience and attracting potential customers.
Conversely, a low NPS means that most customers have a negative perception of your brand. It could be due to delayed email responses, poor product performance, or a slow website. That said, these factors can also negatively impact other customer success metrics like customer satisfaction score and retention rate.
Usually, companies send a single-question survey. For example, you could ask, “On a scale of 0 to 10, how likely are you to recommend our brand to family and friends?”
Based on their answers, respondents are then grouped into three categories:
To calculate your net promoter score (NPS), simply subtract the percentage of detractors from that of promoters.
Many customer success teams now go a step further by using a two-part net promoter score (NPS) survey. This extra space allows customers to provide additional feedback.
This qualitative data is invaluable, helping you understand the specific reasons for a customer’s happiness or dissatisfaction:

Image via InMoment
If your NPS is low, you can improve it by responding to detractors individually. Understand their pain points so you can work on a solution.
You should also send NPS surveys after key moments, such as onboarding or support resolution. When the experience is still fresh in a customer’s mind, they’re more likely to give accurate feedback.
Also Read:
Customer retention rate is the percentage of customers who continue using your product or service over a set period. You can calculate this monthly, quarterly, or annually.
Measuring customer success metrics like retention rate helps you track customer loyalty. A high retention rate means customers are satisfied and continue to see value from using your products or services.
When you have a high retention rate, you don’t need to always acquire new customers. You can spend less on customer acquisition, which can be more costly than retaining existing customers. Also, customers who stay longer generate a higher total revenue.
To calculate the customer retention rate, take the number of customers at the end of a period (monthly, quarterly, or yearly). Subtract the number of new customers acquired during that period.
Then, divide the result by the number of customers you started with. Lastly, multiply by 100 to get the percentage:
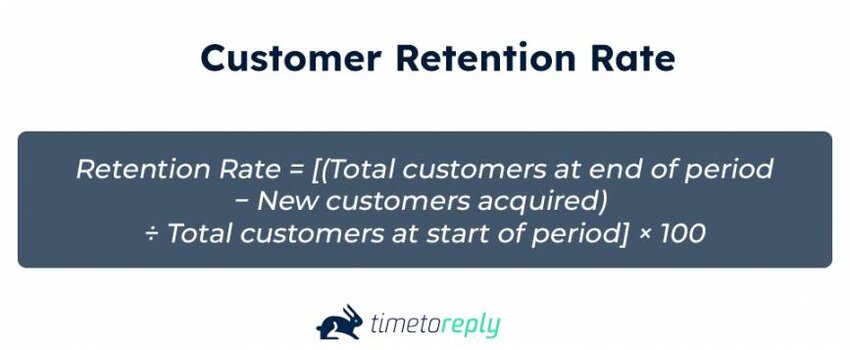
Image via timetoreply
Maintaining a high customer retention rate requires support, sales, and customer success teams to work together and respond consistently.
You can also use an email response management software to track incoming messages and reply faster. This improves email productivity by reducing delays and unanswered emails.
You also need to consistently measure your customer satisfaction score, gather data from customer feedback tools and act on it, and offer personalized customer experiences.
Customer renewal rate is the percentage of customers who choose to renew their contract or subscription at the end of a term. This is one of the customer success metrics for SaaS companies that directly impacts revenue.
High renewal rates mean that your product is useful to the customer beyond the first purchase. On the other hand, low renewal rates are a sign of churn. This leads to lower revenue.
It’s important to track customer renewal rate, so you can forecast monthly recurring revenue (MRR) and assess customer lifetime value (CLV).
When you have estimated customer renewal rates, you can make crucial decisions. For example, how much to invest in marketing, when to expand your team, or how to plan product improvements.
To calculate the customer renewal rate, take the number of customers who renewed their subscription. Then, divide it by the total number of customers who were supposed to renew during that same period. Lastly, multiply the result by 100:
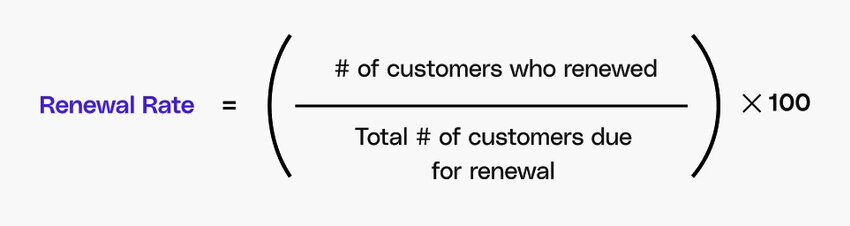
Image via Cello
An effective way to increase customer renewal rate is to engage with customers before their subscription expires, making sure they’re fully taking advantage of the product or service.
For example, your customer success team can review the benefits customers have gained from the product or service against their initial goals or expectations. This will help them see that the product or service is delivering value as promised.
Also Read:
Customer churn rate tracks the percentage of customers who stop doing business with your company within a specific period.
It’s the opposite of customer retention rate and one of the most closely monitored customer success metrics. Even a small increase in churn can impact recurring revenue, especially for subscription-based businesses. High churn usually means customers aren’t seeing the value they expected from your products.
High churn reduces average customer lifetime value (CLV) and increases customer acquisition costs. Conversely, keeping churn low means you’re retaining existing customers. As a result, you can maintain steady monthly recurring revenue (MRR) and grow profitably.
Measuring churn rate also helps you understand the financial impact when customers downgrade to a lower tier.
To calculate churn rate, divide the number of customers lost during a specific period (month, quarter, or year) by the number of customers at the start of that same period. Then, multiply by 100:
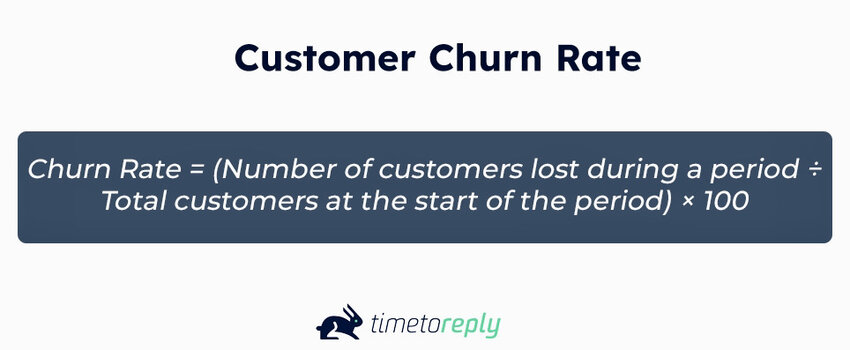
Image via timetoreply
Track customer churn rate alongside other customer success metrics like net promoter score (NPS) and customer health score. This provides context for why customers are leaving, allowing you to address the issue.
Your team can reduce churn by improving first contact resolution rates to prevent customers from getting frustrated. You can also use email reporting software like timetoreply to monitor the performance of individual customer support agents.
Timetoreply allows you to track important customer success KPIs like average response time per agent. Some agents require an unusually high number of back-and-forth emails to resolve an issue.
Identifying this issue ensures you provide adequate training to improve their efficiency and email communication skills.
Customer lifetime value (CLV) represents the total revenue a business can expect to earn from a single customer over the entire relationship. This is one of the customer success metrics that helps you understand the value of each customer beyond a single purchase.
A higher CLV means customers stay longer, make repeat purchases, and generate higher average revenue per user. A low CLV can show that customers aren’t getting enough value from your product.
Tracking CLV also provides insight into how much you can spend on acquiring and retaining customers while still making a profit.
For example, imagine a customer buys a cup of coffee for $5 and never returns. Their CLV is just $5. Then another customer spends $20 per month for one year, for a total CLV of $240. This simple comparison shows why long-term customers are far more valuable than one-time buyers.
To calculate customer lifetime value, consider three factors. These include average purchase value, average purchase frequency, and average customer lifespan. The formula looks like this:
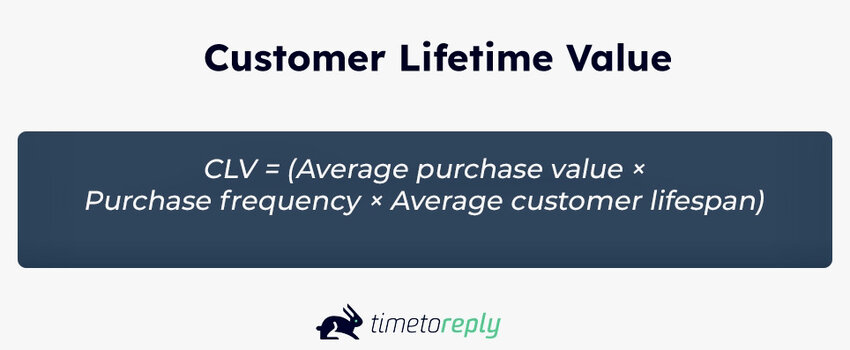
Image via timetoreply
Before you can accurately track CLV, you need to know your average transaction value, repeat purchases, and churn. CLV is calculated based on how often customers buy and how long they stay with your business.
You can improve your CLV by offering additional value through helpful resources, loyalty programs, or product updates. You can also increase CLV by encouraging customers to subscribe to higher-tier plans that add more value to their existing purchase.
Also Read:
Customer acquisition cost measures the average cost required to gain a new customer. This includes sales, marketing, and onboarding costs to turn prospects into paying customers.
While it’s primarily related to sales and marketing, customer acquisition cost is among the most crucial customer success metrics to monitor. It provides an estimate of how much you can spend to acquire new customers. This could include ads, promotions, and the cost of running a sales team.
More importantly, CAC is best monitored alongside your customer lifetime value (CLV). If your CAC is higher than your CLV, it means you’re losing money on every new customer you acquire. One reason could be that your business model isn’t sustainable.
So, you either reduce the acquisition cost or focus on retaining existing customers to increase long-term value.
The formula for calculating customer acquisition cost is the total sales and marketing expenses divided by the number of new customers:
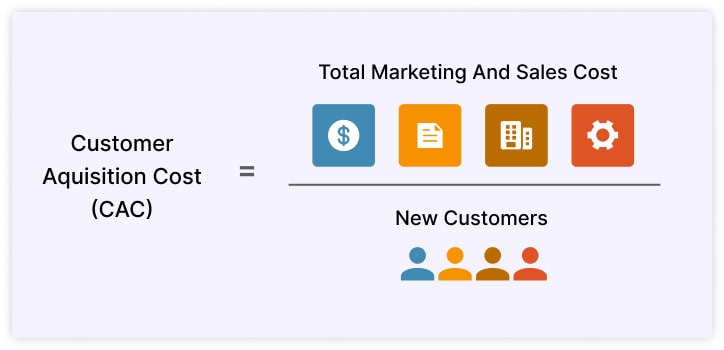
Image via wisernotify
Reducing your customer acquisition cost requires collaboration. It begins with marketing and sales teams targeting. You should prioritize acquiring customers who are likely to spend more money with your business over time, not just become one-time buyers.
Once these customers are onboarded, your customer success managers can then ensure that they quickly realize the product’s value.
This strategy reduces the time to achieve a return on investment (ROI) from your acquisition costs.
Monthly recurring revenue (MRR) measures the revenue your business generates from active customers in one month.
It’s one of the customer success metrics that SaaS companies should pay attention to, since they charge customers a monthly fee rather than a one-time product license fee.
Tracking MRR helps businesses quickly spot churn. It shows lost monthly revenue as soon as it happens. It also shows growth when existing customers upgrade to higher plans or purchase add-ons.
Overall, steady or rising MRR means customers are staying and still finding value in your product.
Calculate your monthly recurring revenue by multiplying the number of paying customers by the average revenue per user (ARPU):
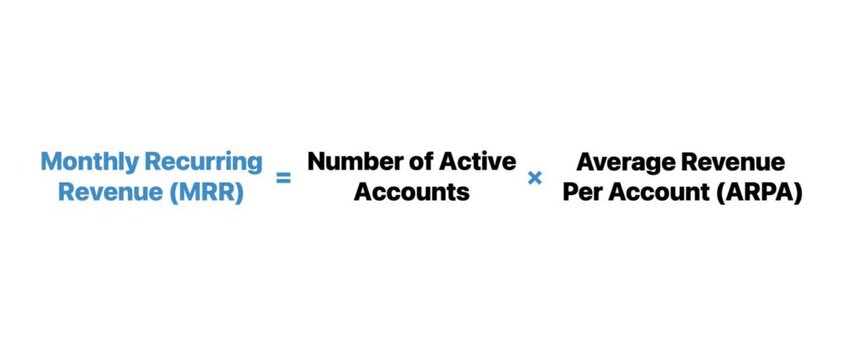
Image via Wall Street Prep
Let’s say an email analytics software company has 500 active users per month, and the average revenue per customer is $200. Its monthly recurring revenue will be $10,000 (500 x $200).
You can also break down your monthly recurring revenue into other components, such as MRR from new customers, upsells and cross-sells, and those lost from cancellations (churned MRR).
If your MRR is declining, you should focus on helping customers make the most of your product or service. It’s one way to reduce subscription cancella tions. You can do this by providing onboarding support and regular check-ins to ensure they’re using key features and achieving the results they want.
At the same time, you can expand your monthly recurring revenue in many ways. For example, you can help them see the value in moving to higher-tier plans, adding more users, or unlocking additional paid features.
Customer support teams can also contribute by replying quickly to customer issues, resolving problems in the first interaction, and giving clear, helpful responses. This helps customers stay satisfied, which reduces the risk of them leaving.
Also Read:
Average revenue per user calculates the average revenue generated from each active customer over a specific period, usually monthly or annually.
While monthly recurring revenue shows the total revenue generated from all customers, average revenue per user shows how much revenue each customer generates on average.
As one of the top customer success metrics, you need to track ARPU because it reveals your high-value customers and least spenders. It also helps you evaluate whether your customer success strategy is driving conversion and engagement.
That said, you can’t track MRR effectively without ARPU because both metrics provide deep insights into business growth. For example, if MRR is increasing but ARPU stays the same, it may indicate that only a few customers are driving sustainable growth.
An increasing ARPU is also one of the customer success metrics, indicating that customers are gaining value from your product or service. Otherwise, they may cancel subscriptions or downgrade to lower-tier plans.
To calculate average revenue per user, divide the total revenue generated within a period by the number of active customers during that same period:

Image via growthmentor
You can improve ARPU by building stronger customer relationships through personalized account reviews. This involves a one-on-one review of a customer’s usage, needs, and plan to identify opportunities for upgrades or expansions.
Your team can also improve customer service by ensuring quick issue resolution and maintaining a high customer satisfaction score. These steps tie in together to encourage customers to keep using your product.
Qualitative customer feedback is descriptive feedback customers share in surveys, reviews, or support conversations. It helps customer success teams understand the reasons behind customer sentiment, whether it’s satisfaction or frustration. It also helps them understand why customers leave.
Unlike NPS or CSAT scores that only show how customers feel, qualitative feedback explains why they feel that way. It helps teams identify specific friction points in onboarding, product usage, or customer support that would otherwise stay hidden in numerical data.
This allows customer success teams to fix the real causes of dissatisfaction before they lead to churn or lost revenue.
There are many ways to gain qualitative customer feedback. You can do this through surveys, support tickets, user interviews, and social media interactions.
You don’t need a formula to track qualitative customer feedback. It’s about collecting and analyzing open-ended responses to pinpoint recurring themes.
For example, you can send a survey asking, “What’s the one thing we could do better?” After analyzing 50 responses, you notice that:
You now have three specific, actionable themes to address. But gathering data isn’t enough. Customer success managers must hold regular check-ins and help solve these issues. This way, you can build trust with customers because you show that their concerns are actually being addressed.
Also Read:
Customer support ticket patterns refer to the types of issues customers report to support agents, the total number of tickets raised, and how often the same issues recur over a specific period.
This shows your customers’ most frequent problems and how widespread each issue is. For example, your customers could be struggling with confusing features, prompting them to submit support tickets.
This also ties in with other customer success metrics. For example, if many customers report the same bug or confusion around a feature, it often leads to lower customer satisfaction (CSAT) and higher customer effort scores (CES).
Analyzing customer support ticket patterns also shows whether your support team is giving clear and helpful responses to customer inquiries and concerns.
However, unlike other customer success metrics, support ticket patterns don’t have a specific formula.
Simply categorize tickets by issue type to see exactly why customers are contacting support. To reduce recurring ticket issues, you shouldn’t just aim for first contact resolution. You should also consider the following steps:
By fixing the root causes of customer problems, you eliminate repeat support issues. This improves customer engagement, which details how actively customers use your product. It also lowers churn and increases support efficiency by reducing the number of support tickets you receive.
Customer success metrics improve your company’s operational efficiency and financial health. They also help maintain a positive customer sentiment. Metrics like customer effort score (CES) and first contact resolution (FCR) measure frictions in workflows. Indicators like customer lifetime value (CLV) and churn rate determine your business’s sustainability.
You can improve customer success metrics by making onboarding easier for new users and increasing product engagement. You can also apply customer feedback to enhance the customer experience. The goal is to help customers adopt the product faster, stay engaged longer, and reduce churn.
You can also leverage multi-threading. This involves connecting with multiple stakeholders within the customer’s organization. With this strategy, you can prevent delays caused by lost contacts, stalled setup, or unavailable decision-makers.
Monitor product usage milestone velocity. This measures how quickly users reach key actions in the product. This could be completing onboarding or creating their first project. This way, you can identify where users get stuck, allowing support teams to step in, which helps improve customer success metrics.
Analyze open-ended responses to understand the root causes of customer problems. Acting quickly on negative feedback helps fix issues early and makes customers feel valued.
To improve customer success metrics, you should help customers get value faster through better onboarding. You can also keep customers engaged by tracking how they use the product. Spot where they’re struggling or losing interest, and then improve those areas.
You can also continuously improve customer experience by applying customer feedback. This leads to higher customer retention, fewer cancellations, and more sustainable long-term revenue growth.
1. What are customer success metrics?
Customer success metrics show how well a business helps customers achieve their goals using a product or service. These metrics measure customer satisfaction, retention, or churn. Understanding these metrics helps reduce churn and improve long-term customer relationships.
2. Are customer success metrics and KPIs the same?
No. Customer success metrics are data points about the customer journey, such as product usage, login frequency, and support tickets. KPIs (key performance indicators) are metrics tied to goals, such as growth or retention. For example, they include churn rate, customer lifetime value (CLV), and expansion revenue. In a nutshell, all KPIs are metrics, but not all metrics are KPIs.
3. What are key customer success metrics?
The top customer success metrics you should track in 2026 include:
4. What are customer success metrics for SaaS companies?
The key customer success metrics for a SaaS business are those that help measure customer success, forecast revenue, and ensure customers are gaining value from their subscriptions. These include monthly recurring revenue (MRR), customer lifetime value (CLV), customer churn rate, customer renewal rate, average revenue per user (ARPU), and product adoption rates.
5. What is the customer success manager scorecard?
The customer success manager (CSM) scorecard is a tool for tracking KPIs like retention rate, customer health score, renewal revenue, upsell success, and customer satisfaction. It shows how well a CSM retains customers, drives renewals, increases customer satisfaction, and improves customer success metrics.
6. What are the four main KPIs in customer service?
The four main customer service KPIs are first-contact resolution rate, average response time, customer satisfaction score (CSAT), and net promoter score (NPS). They’re used to measure how effectively a support team resolves customer issues.
7. What are the 5 pillars of customer success?
The five pillars of customer success are onboarding, product adoption, customer support, relationship management, and value realization. These pillars guide how customer success teams deliver measurable outcomes. Aligning your customer success metrics with these pillars can improve customer relationships, retain existing customers, and increase customer lifetime value.
8. How do you handle difficult customers?
Handling difficult customers requires patience, empathy, and problem-solving skills. Customer-facing teams should listen actively, acknowledge the customer’s concern, and provide clear responses. Your team should also improve customer success metrics and reduce frustration by resolving issues quickly and following up. This ensures customers feel valued.
Also Read:
Customer success metrics help you understand how customers interact with your products, how satisfied they are, and if they’re likely to renew their subscriptions.
In this article, we’ve covered 15 customer success metrics that help teams improve retention, identify churn risks, and drive long-term revenue growth.
To improve them, you should track these metrics across the full customer journey. This includes onboarding, product engagement, retention, and customer support performance.
The next step is action. Improve onboarding, monitor customer engagement, including product usage, and apply customer feedback to fix issues before they affect retention. When done right, these efforts build stronger customer relationships and increase revenue.
If email is your main support channel, consider using automation tools like timetoreply to track and improve customer success metrics. Its email analytics and reporting tools help customer service teams improve response times and track unanswered emails in real time.
Get live inbox alerts and reply quickly to customer emails with timetoreply

Head of Customer Success @ timetoreply
Barry Blassoples is the Head of Customer Success at timetoreply, where he helps customer-facing teams boost revenue and protect brand reputation by providing actionable insights to improve their business email response times. He has over 15 years of leadership experience across customer success, sales, and marketing roles in high-growth tech companies.



Trusted by high-performing inbound sales teams and customer-facing teams globally.
Close more deals and delight more customers with the faster, smarter, deeper email analytics and performance optimization software that works straight from your team’s inbox.