
The process has six steps. Group accounts into tiers, set a baseline for each one, and define thresholds by tier. Then, add email signals to your health score, send alerts to an owner, and review which signals are useful.
Customer frustration can build in the inbox before it reaches someone who can resolve it. If missed, a cancellation notice may be the first clear warning of account risk.
A surprise cancellation can be costly when existing customers drive much of your revenue. ChurnZero’s 2025 survey found that 74% of 793 customer growth leaders said existing customers generate most revenue.
This guide explains how to spot customer risk early from the inbox and measure if your approach is working.
Customer risk refers to the likelihood that an existing account will cancel, reduce spend, or fail to renew. It simply means churn risk. At-risk customers are accounts already showing those signals. To spot customer risk early, watch the risk signals account by account, week by week.
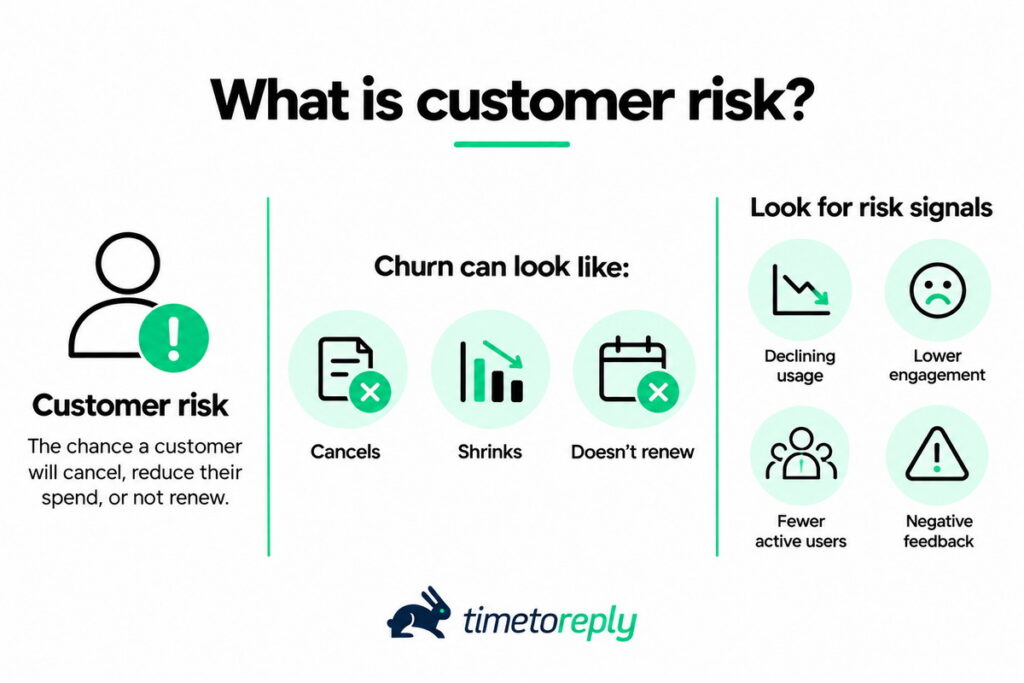
The wider practice of scoring every risk type across your account base is called customer risk analytics.
Churn happens when a client ends or reduces spend in a paid relationship. Churn risk measures how likely that outcome is over the next few quarters.
Start with the inbox if you want to spot customer risk early in email-led relationships. Use those signals to take action to reduce churn.
This guide doesn’t cover credit, fraud, or compliance risk. Those use similar words, but they focus on payment, fraud, and compliance issues.
It can be hard to spot customer risk early because the first warning signs look like normal changes. A slower reply or quiet month may not seem unusual. These changes can seem harmless when viewed on their own.
The problem is that small changes can build over time. A customer may reply less, ask the same questions, or stop following up.
Many health dashboards track product usage, but B2B relationships often run through email communication. This leaves teams with less visibility into changes happening in customer conversations.
Risk can also increase when your team gives a customer mixed answers. McKinsey’s 2026 B2B Pulse survey found that inconsistent information across teams was the primary reason 52% of buyers switched suppliers.
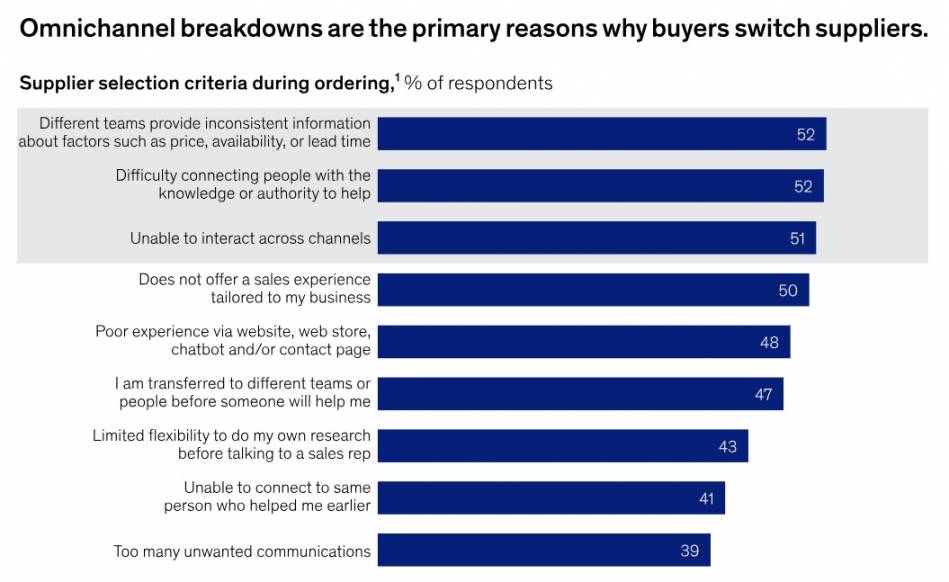
Image via McKinsey
Customer risk is the chance that a customer may leave, spend less, or not renew. It can show up in email through slower replies, fewer messages, or more unanswered emails.
Also Read:
Early warning signs of customer churn in email include shifts in how a B2B account writes and gets answered. Signs include long wait times, repeated follow-ups, changes in tone and language, and unanswered questions.
Two more churn indicators also point to account risk. The account goes quiet, or the people on the thread change. The table maps all six customer risk indicators and what they look like.
| Signal | What it looks like on an account | Signal type | Common false alarm |
| Slower replies | Your team’s replies to one account drift slower over several weeks | Operational | A planned holiday or a short staffing gap |
| Stacking follow-ups | The contact chases the same request more than once | Operational | A contact who always sends quick reminders |
| Unanswered questions | Replies go out, but specific questions stay open | Operational | Questions answered on a call and never written down |
| Tone and sentiment shift | Emails get shorter, colder, or more formal over weeks | Relationship | A new contact whose normal style is brief |
| Silence | The gap between inbound emails grows past the account’s usual rhythm | Relationship | A seasonal lull or a finished project |
| Contact changes | The champion leaves the thread, procurement joins, or emails bounce | Relationship | A planned role change with a clear handover |
Let’s break down how to read these signals and spot customer risk early.
Your reply times are one of the first signals to watch to spot customer risk early. If replies slow down week after week, the account is getting slower service than before. The customer may not have complained yet, so the change can be easy to miss.
Measure the reply time for each account, not just across the team. A healthy team average can still hide important accounts that experience delayed replies. Compare each customer account with the standard reply time so you can spot any changes that occur.
Repeated follow-ups signal that a customer’s request is still waiting for an answer. A reminder may be normal, but several reminders on one thread deserve attention.
Customers also dislike repeating information they have already shared. Zendesk’s CX Trends 2026 report found that 74% of consumers said repeating information frustrates them.
A follow-up that repeats the original request can mean the customer feels ignored. When this happens more than once, take a closer look at the thread.
Unanswered questions are a quieter signal than slow replies, and they’re easy to miss. Your team replies on time, so the thread looks handled. But the specific question the client asked never got an answer.
Busy inboxes make these gaps even harder to spot. Microsoft’s 2025 Work Trend Index shows the average worker gets 117 emails a day, most skimmed in under a minute.
Check whether each reply answers the question in the message it responds to. A quick scan of the original customer service email before sending can catch this.
Then set an SLA response time for full answers, so a quick acknowledgment doesn’t stop the clock.
Also Read:
A tone shift is a warning sign when an account’s emails get shorter, colder, or more formal over several weeks.
For example:
Earlier: “Hi team, hope you’re well. Could you take a look at this when you get a chance?”
Later: “Please resolve this issue and confirm when it is done.”
Here’s a visual example of a tonal shift in customer emails.
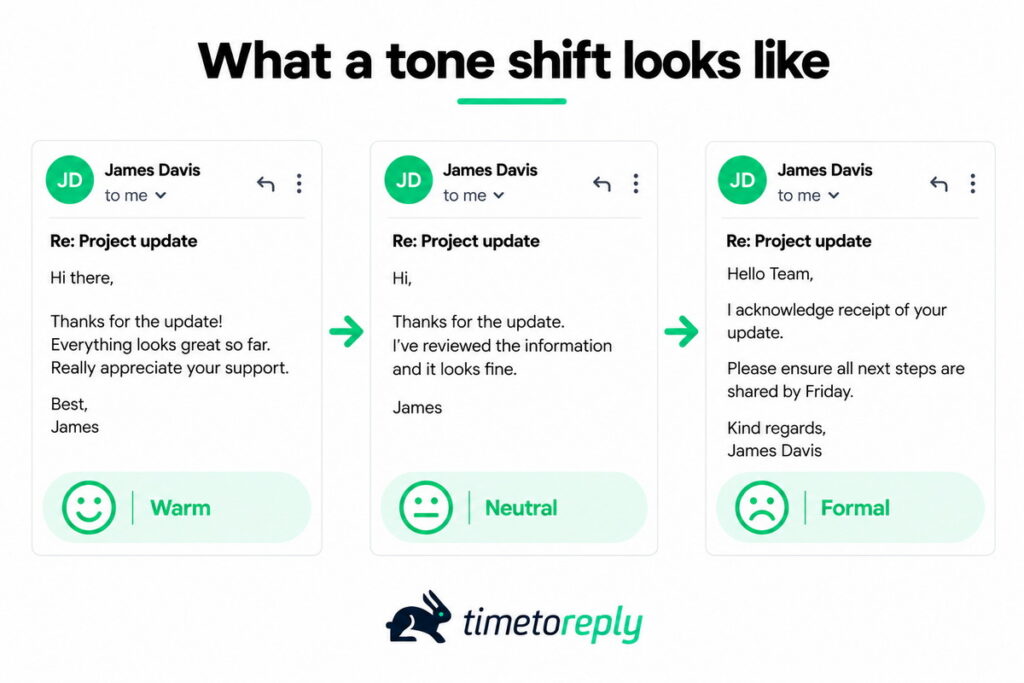
Also watch out for language that focuses on past problems. Phrases such as “like we discussed last month” or “this has happened several times” becoming frequent can signal frustration.
With email analytics, you can compare recent emails with the account’s usual tone to spot customer risk early. Look for changes that continue over several weeks, rather than one unusual message.
Sentiment analysis can help track tone across many accounts. A blunt note from a busy CFO may mean little. A similar change from a usually friendly contact may matter more.
Pair a tone shift with the reply-time and follow-up signals on the same account before you act. Together, they’re a strong cue to start customer churn prevention.
An account going quiet is easy to misread because silence can seem like a good sign. A customer who used to email every week may suddenly stop. They may no longer need your help, or they may be speaking with someone else.
To spot customer risk early, compare the period of silence with the account’s response pattern. Some accounts send emails daily, while others may send emails once a month. Measure the gap between inbound emails against each account’s normal rhythm.
You can also count declined or unanswered meeting invites as signs of reduced customer engagement. Look for a clear change from the account’s usual activity rather than applying one rule to every account.
Changes in who joins or leaves an email thread can signal account risk. When your champion drops off the thread, or procurement joins, someone new may influence the account’s next decision. Find out why, and who now holds the budget, before the renewal conversation starts.
Bounce-backs are another signal you should watch. If an automatic reply says that your contact has left the company, the relationship needs rebuilding. Find a new contact and ensure that the account still has an active point of contact.
Keep a contact map for each key account. Note who usually writes, who approves, and who pays. Flag changes so you can spot customer risk early and optimize customer experience.
Customer churn can show up in email through slower replies, repeated follow-ups, unanswered questions, and changes in tone. Silence and changes in who joins the conversation can also signal account risk.
Also Read:
To spot customer risk early, start by grouping accounts and setting baselines. Then define thresholds, score risk, assign alert owners, and review the process each quarter.
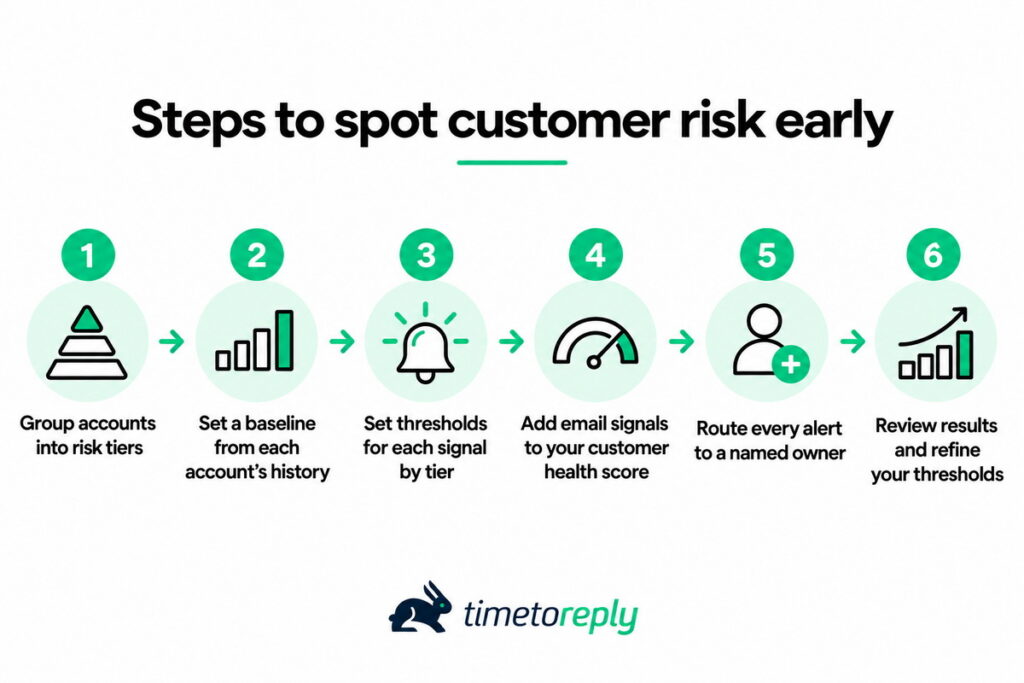
Sort customer accounts into risk tiers so you can set alert thresholds based on their value and importance. A missed warning can have a greater impact on a larger account. Focus your monitoring where the potential cost of churn is highest.
To start, use three simple tiers:
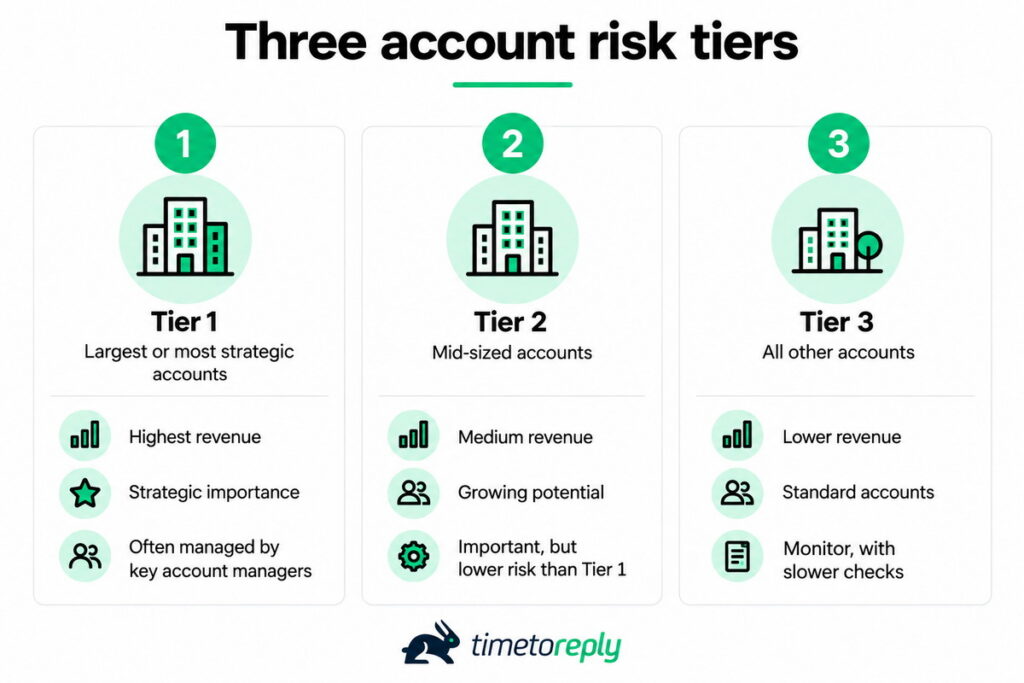
Once you’ve grouped your accounts, look at each one’s usual email patterns. Step 2 shows you how to establish a baseline for comparison.
Establish clear reply-time rules for each customer tier. For example, Tier 1 accounts can have a two-hour response target for quick replies. Tier 2 and Tier 3 accounts can have longer targets.
Base the exact times on your team’s capacity, customer commitments, and business needs. What matters is that every tier has a defined standard.
Then use each account’s own history to spot changes against that standard. Without a baseline, normal changes can trigger false alarms and make it harder to spot customer risk early.
Use a full quarter of history when possible. With timetoreply, you can shorten the wait for that data. It backfills 14 days of email history when you connect it. This gives you response-time data from the start.
Track these patterns per account: median reply time, open questions and follow-ups per thread, inbound gaps, active contacts, and usual tone. The same data helps you improve email response times wherever an account lags.
Each signal needs a clear point where a change should trigger an alert. Set thresholds for each signal by tier. Tier 1 accounts should get tighter rules. That way, you can spot customer risk early in key accounts without disturbing the team.
The values below are illustrative starting points, not benchmarks. Most are relative to the account’s own baseline, so tune them all against your data.
| Signal | Tier 1 | Tier 2 | Tier 3 |
| Reply time | Weekly median above 1.5× the account’s usual median for two weeks | Weekly median above 2× the usual median for two weeks | Weekly median above 3× the usual median for three weeks |
| Follow-ups | 2 unanswered follow-ups on any thread | 3 unanswered follow-ups on any thread | 3 unanswered follow-ups on two or more threads |
| Unanswered questions | Any question open longer than 2× the median reply time | Any question open longer than 3× the median reply time | Any question open longer than 4× the median reply time |
| Silence | Inbound gap above 2× the account’s usual gap | Inbound gap above 3× the usual gap | Inbound gap above 4× the usual gap |
| Tone and sentiment | Two emails in a row clearly more formal than the contact’s usual tone | Three such emails in a row | A clear shift across a month of emails |
| Contact changes | Any change to the champion or approver on the contact map | Champion leaves the thread | Champion leaves, and emails bounce |
Keep reply-time thresholds inside your SLA compliance targets, so a Tier 1 alert fires before a breach. Review the numbers monthly for the first quarter. If a threshold fires every week, it’s too tight for that tier.
Also Read:
Email patterns can show changes that other health metrics may miss. Pair them with usage, support tickets, payments, and renewal dates. Your team would have more context to spot customer risk early.
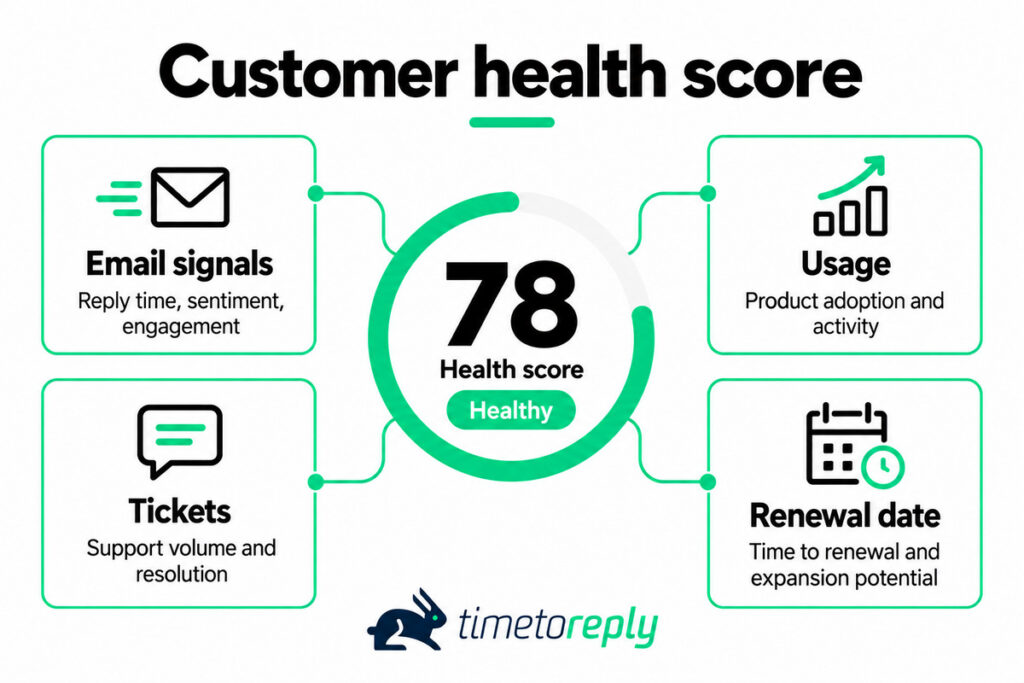
A score can stay green while the customer relationship starts to weaken. Email signals can show that change without replacing the service metrics you already use.
Give each email signal a weight in the customer health score you already use. Score it on the same scale as your other customer success metrics.
When an alert comes in, assign it to a named owner with a clear deadline. That way, everyone knows who is responsible for following up. Send Tier 1 alerts to the account manager for same-day review, and lower-tier alerts within the week. Alerts help you spot customer risk early, but only owners act on them.
timetoreply alerts your team when a conversation is approaching or missing the SLA target you set.
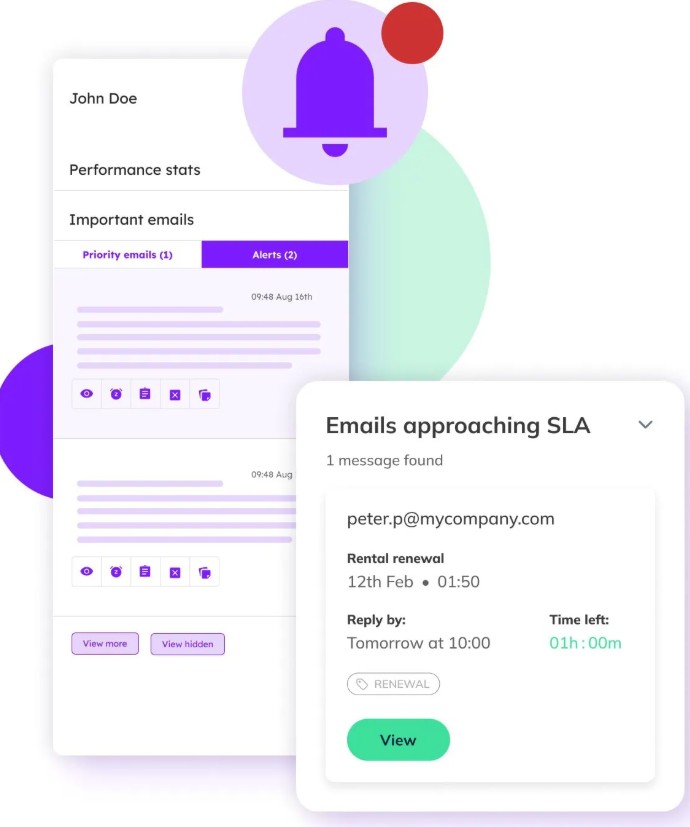
Image via timetoreply
Reaching out before the client chases again is proactive customer support. Weekly checks make customer escalation prevention routine. Write the actual save steps into your customer success playbook, so every owner follows the same plan.
Once at-risk customers have owners, review which alerts were right, which is the next step.
Review which signals came true every quarter, then retune your thresholds and weights. Some alerts will flag accounts that were fine. Some accounts will leave without ever triggering an alert. Both results tell you how to adjust, so the next warning is more accurate.
Review the account that churned or downgraded. Check the signals that appeared first and when they did. Perform customer churn analysis to see the signals that are important for each customer segment. Loosen thresholds that trigger too often and tighten those that miss warning signs.
Run this review for two or three quarters. Over time, your thresholds will reflect real account behavior. Use those patterns to spot customer risk early without overreacting to normal changes.
Use a six-step routine to identify and work on email signals. Start with setting account tiers and baselines, then set thresholds, score risk, assign owners, and review what worked.
Also Read:
These metrics show whether you spot customer risk early: lead time, alert precision, missed-churn rate, and save rate. Retention outcomes such as churn rate and revenue retention confirm the result. If churn risk alerts arrive early, prove right, and get acted on, customer retention should improve.
The table details how to calculate each metric.
| Metric | What it tells you | How to calculate it | Watch out for |
| Signal lead time | How early warnings arrive | Days from the first alert to the cancellation notice or renewal decision, averaged across correctly flagged accounts | Long lead times with low precision are mostly noise |
| Alert precision | Whether alerts deserve attention | Flagged accounts that were truly at risk, divided by all flagged accounts | Define “truly at risk” upfront: churned, downgraded, or a real problem confirmed when the owner reached out |
| Missed-churn rate | The risk your system can’t see yet | Churned accounts that were never flagged, divided by all churned accounts | Small samples swing the rate |
| Save rate | Whether owners act in time on flagged accounts | Flagged at-risk accounts that renewed, divided by all flagged at-risk accounts whose renewal date has passed | Some accounts would have renewed anyway |
| Customer churn rate | How many customers you lose | Customers lost in a period, divided by customers at the start of that period | Name the period and unit, and leave out customers added mid-period |
| Gross revenue retention | Revenue kept, before expansion | Starting recurring revenue from existing customers, minus churned and downgraded revenue, divided by that starting revenue | A revenue measure, never a customer count |
| Net revenue retention | Revenue kept, including expansion | Starting recurring revenue from existing customers, minus churned and downgraded revenue, plus expansion, divided by that starting revenue | Expansion from some accounts can hide churn in others |
Also Read:
1. How do you predict customer churn?
You can predict customer churn by tracking the signals that appear before a customer leaves. For email-led accounts, watch for slower replies, repeated follow-ups, unanswered questions, tone shifts, silence, and contact changes.
Compare each of the accounts with its own history to spot customer risk early. Set tier-based thresholds, assign each alert an owner, and review which alerts proved accurate.
2. What does churn mean in business?
Churn means a customer stops using your service or reduces their spending. A cancellation or non-renewal loses the customer, while a downgrade loses part of the revenue.
Churn rate is the share of customers you lose in a period. Churn risk is the chance an account will leave or shrink soon, based on warning signs you can see today. Revenue churn tracks the lost money instead.
3. What is a high-risk customer?
A high-risk customer is an account showing several warning signs at once. Slower replies, a quiet inbox, and a new contact are typical examples.
4. What are the main causes of customer churn?
Customers can leave when the value or service no longer meets their needs. Also, McKinsey’s 2026 B2B Pulse survey found inconsistent information to be the top reason buyers switched suppliers. In email-led accounts, service issues can show up as slow replies or unanswered questions. Repeated follow-ups can also signal that customers are not getting the support they expect.
5. Can AI predict churn?
AI can help predict churn by spotting patterns across large volumes of customer emails. It can flag changes in tone, response patterns, urgency, and intent. These signals can help you spot customer risk early.
But AI can still miss context or misunderstand a customer’s tone. That’s why you should take alerts simply as a reason to review the account, not as direct proof of churn. Also, set data rules before you use AI to analyze customer emails.
6. How is customer churn different from revenue churn?
Customer churn measures the percentage of customers you lose during a period. Revenue churn measures the recurring revenue lost from those customers.
A business can have low customer churn but high revenue churn if a few large accounts leave. Track both measures to see whether churn is affecting customer numbers, revenue, or both.
7. What does 5% churn mean?
5% churn means you lose 5% of your starting customers in a given period. The period changes everything, so check whether the figure is monthly or annual before you compare it.
A 5% monthly churn rate compounds. Held for a year, it loses about 46% of the customers you started with. A 5% annual rate is a far smaller loss.
8. What is a normal customer churn rate?
There’s no single churn rate you can reliably use as a benchmark. Few published churn benchmarks cover B2B service firms, so your own history is the safer yardstick.
For private B2B SaaS, SaaS Capital’s 2025 benchmarks put median gross revenue retention at 91%. That’s a revenue measure, so don’t read it as a churn rate. Track your own churn rate by tier.
9. How do you track customer churn rate?
Take the number of customers you lost and divide it by your starting customer count. Make it clear whether you’re measuring customer churn or revenue churn. Review the rate each month and look at the yearly trend. Then break it down by account tier to see where churn is actually coming from.
10. Can you give me an example of customer churn?
Say a company uses your project management software and has been paying for it every month. They used to log in regularly, email your support team, and add new users as the team grew.
Over time, that activity drops. They stop adding users, contact support less often, and eventually cancel the subscription. The customer leaving the service is churn, and the revenue you lose from that account is the cost of that churn.
You can spot customer risk early by treating email as a key source of account signals. Slow replies, open questions, stacked follow-ups, and changes in the account’s tone and contacts often come before a cancellation.
The signals can help predict churn if they’re monitored and acted on. Baseline each account, set tier-based thresholds, and assign an owner to every alert. That’s how you can spot customer risk early and still have the time to act.
This week, pick your top-tier accounts and compare their reply times and inbound gaps with last quarter’s. Any account that has drifted is your first review. Book a demo to spot service risks earlier with the signals hidden inside customer emails using timetoreply.
Get live inbox alerts and reply quickly to customer emails with timetoreply

CEO @ timetoreply
Howard Moodycliffe is CEO of timetoreply, an email analytics & relationship intelligence platform for B2B customer-facing teams. He writes about email performance, SLA management, and how organisations can use communication data to protect customer relationships and revenue.
Trusted by high-performing inbound sales teams and customer-facing teams globally.
Close more deals and delight more customers with the faster, smarter, deeper email analytics and performance optimization software that works straight from your team’s inbox.