Common customer service analytics use cases include tracking response times, improving self-service, and finding service gaps early. Teams also use analytics to monitor customer satisfaction and workload trends.
These insights help support managers make faster decisions. They can quickly spot delays, overloaded agents, or repeat customer complaints.
That helps teams improve support before service quality drops.
In this post, we’ll look at the top customer service analytics use cases. You’ll also learn the main KPIs you should track and the best ways to use support data more effectively.
Customer service analytics is the systematic process of collecting, analyzing, and interpreting service-related data to reduce response times and improve service delivery.
Instead of relying on assumptions or anecdotal feedback, customer service analytics gives decision-makers a data-driven perspective of what’s working, what isn’t, and where teams can improve.
Customer service analytics can transform day-to-day support interactions from emails, calls, and chats into strategic insights that help companies improve service quality and retain more customers.
Companies can better understand their performance by tracking key support metrics like first response time (FRT), customer satisfaction scores (CSAT), and ticket resolution rates.
Beyond these foundational metrics, advanced tools, such as timetoreply, provide real-time alerts when SLAs are at risk or team members fall behind on reply time targets.
This added layer of insight enables managers to distribute workloads more effectively, coach with purpose, and plan resources better. It also creates clear benchmarks and more visibility into agents’ performance.
And for customers, leveraging customer service analytics use cases results in faster, more personalized, and more reliable support interactions.
When implemented well, customer service analytics can power many improvements, from daily efficiency gains to long-term customer experience strategy.
The top customer service analytics use cases remain the same across industries. Teams use analytics to improve response times, identify churn risk, and boost team productivity.
The broader goals are to improve customer experience by delivering responsive support.
Here are the 10 most common customer service analytics use cases.
Here’s how analytics-driven strategies are reshaping customer service.
Slow responses frustrate customers and damage your brand reputation. Delays significantly impact customer retention and brand perception in an environment where customers expect rapid resolutions.
That’s why using real-time data to monitor and improve response times across various channels is one of the most valuable customer service analytics use cases.
To maintain fast and efficient customer interactions, track key customer service metrics like:
Tools like timetoreply shine here, offering live inbox alerts that notify agents and managers when reply times approach or exceed SLA thresholds. This allows for reassigning tickets, flagging delays, and coaching team members before problems escalate.
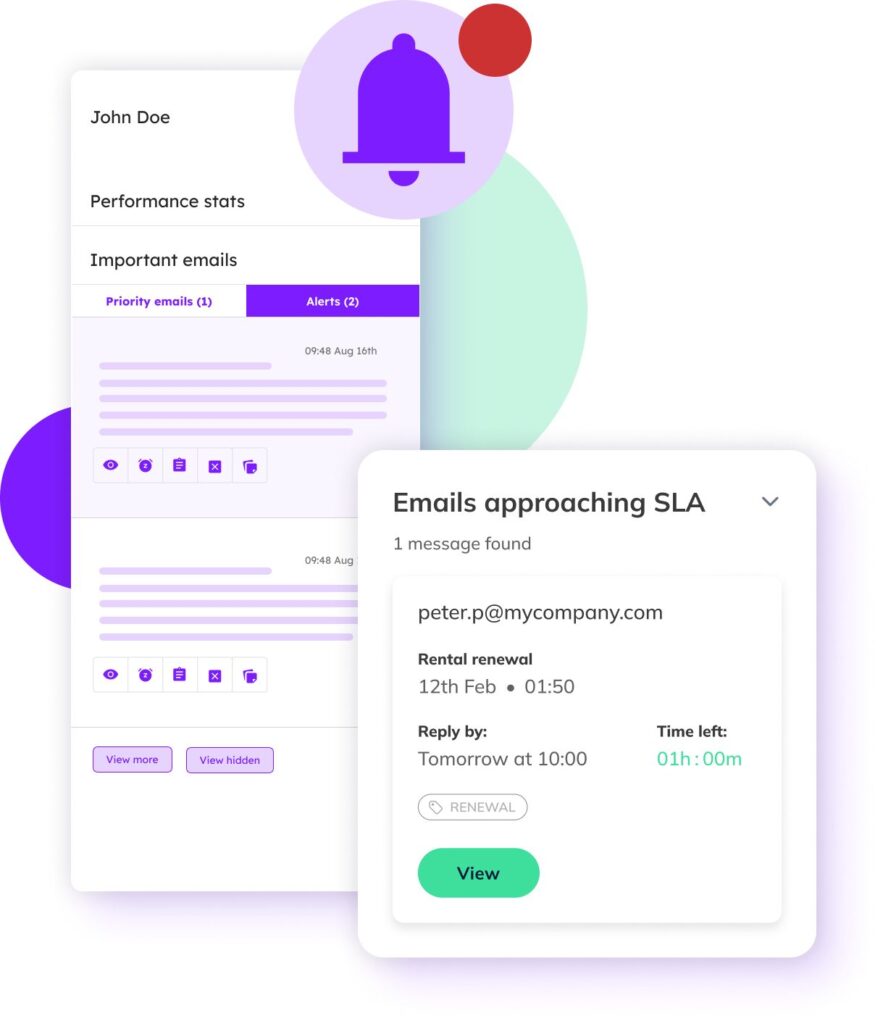
Image via timetoreply
Analyzing historical response time trends in broader support environments can reveal bottlenecks by shift, day, or channel.
For example, scheduling adjustments or automation might be needed if chats consistently go unanswered on Friday afternoons. Over time, tracking these patterns leads to better staffing decisions and noticeable improvements in customer satisfaction.
Also Read:
One of the most valuable customer service analytics use cases is spotting when customers risk churning and why.
You can detect warning signs and intervene proactively by analyzing interaction trends, complaint frequency, and response quality.
Watch for patterns that commonly indicate dissatisfaction, such as:
Using insights from customer service analytics use cases, teams can intervene early. For instance, a SaaS company might learn that users who submit 3 or more tickets within 30 days have a high risk of churn.
With that knowledge, customer success managers can proactively reach out with solutions or personalized support.
Basic customer experience analytics can reveal early signs of retention risks even without complex algorithms. A sudden drop in support engagement or emotional keywords in feedback might signal that someone is ready to leave.
Forecasting demand is one of the more strategic customer service analytics use cases you could leverage. With the right metrics, you can predict ticket surges and staff accordingly, preventing customer frustration during high-volume periods.
Analyzing historical patterns alongside business activities makes it possible to develop remarkably accurate volume predictions.
Effective support volume forecasting requires monitoring these predictive factors:
Let’s say an ecommerce retailer discovers its customer email volume consistently spikes 48 hours after promotional campaigns. This insight allows managers to adjust schedules and temporarily reassign team members during predicted surge periods.
Beyond preventing service degradation, accurate volume prediction enables more strategic resource allocation. It helps transform chaotic, busy seasons into planned, manageable events with appropriate staffing.
An efficient customer support team thrives on solid insights, not assumptions. Individual agent analytics can reveal performance variations across your team, enabling targeted coaching and best practice sharing.
By tracking individual metrics alongside team averages, managers can identify performance gaps and exceptional techniques worth replicating. Effective agent performance optimization focuses on these key indicators:
Tools like timetoreply, which offer customizable dashboards and leaderboards, allow team leaders to compare individual agent response rates. This makes it easier to understand why certain agents consistently resolve issues faster or achieve higher satisfaction scores.
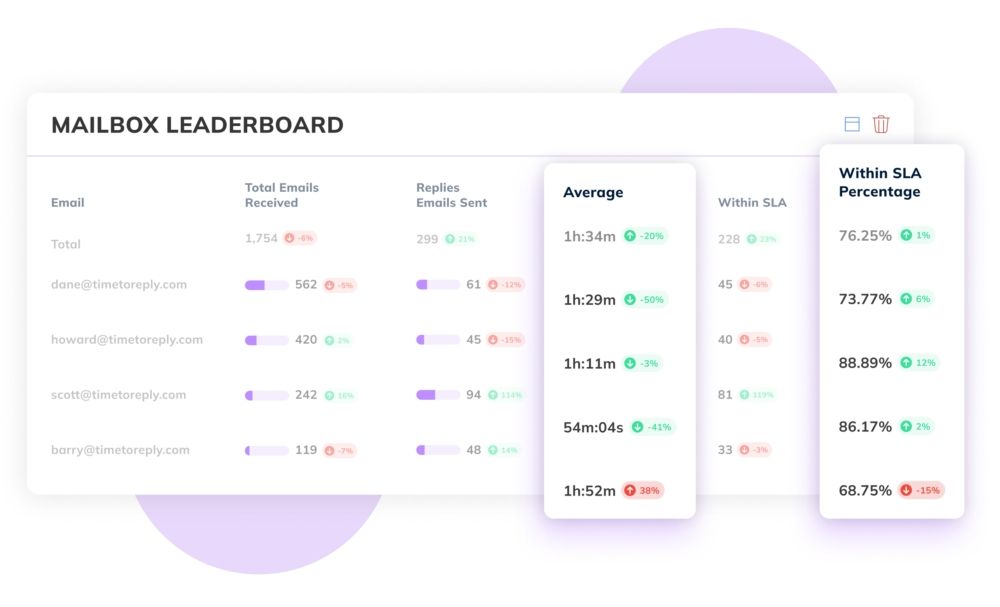
Image via timetoreply
This data allows managers to identify coaching opportunities, reward high performers, and spot burnout risks early. For instance, if an agent has low CSAT but high ticket volume, they may be over-assigned or handling overly complex cases.
Also Read:
Customer service analytics use cases aren’t limited to live agent performance. They also enhance your self-service channels.
You want to analyze what customers search for, where they drop off, and which help center articles get the most views (or none at all). This way, you’re better equipped to refine your team’s knowledge base for clarity and relevance.
Key customer service metrics to track include:
Let’s assume your users frequently search “cancel subscription” but escalate anyway. This could mean that your guide is incomplete or unclear. Addressing this boosts self-service success and lowers ticket volume.
Over time, improved self-service translates to reduced agent workload and faster resolutions for everyday issues. It also translates to a better overall customer experience, especially for customers who prefer solving problems independently.
One of the more strategic customer service analytics use cases is using interaction data to personalize service. This is crucial, as customers today expect support that reflects their history, preferences, and past concerns.
By ensuring support teams can deliver relevant assistance, tailored experiences strengthen customer relationships. To enable personalization, monitor metrics and customer dimensions like:
A customer who has made multiple premium purchases and left glowing feedback may expect faster, higher-tier support. By leveraging customer service analytics, agents can tailor their tone, urgency, or escalation path.
Indeed, email analytics tools like timetoreply can help you understand which types of responses generate the highest satisfaction for different customer segments.
This insight allows organizations to create dynamic email templates that address common questions while incorporating personalized elements based on customer data.
Service level agreement (SLA) compliance represents one of the more critical customer service analytics use cases, transforming SLAs from contractual obligations into actionable performance frameworks.
By continuously monitoring commitment metrics, support teams can prevent compliance failures before they occur, particularly for premium clients with strict service requirements.
To maintain SLA compliance and ensure comprehensive management, track these metrics:
Customer service analytics tools track whether teams consistently meet response deadlines, ensuring customers receive timely support. Features like timetoreply’s live monitoring can be especially valuable for email-driven businesses.

Image via timetoreply
This live monitoring feature flags delayed responses that approach or breach SLA requirements. It helps to quickly determine when SLA adherence drops so organizations can immediately reassign resources to prevent compliance failures.
Also Read:
Customer service analytics are good for a lot more than just reactive problem-solving. They play a vital role in shaping long-term strategy, including helping identify service trends, pinpoint recurring issues, and adapt to customer expectations more effectively.
Once you establish the emerging patterns in customer inquiries, you can make proactive decisions about product development, marketing messaging, and resource allocation.
Effective strategic analytics focuses on these revealing indicators:
For example, an ecommerce company may analyze customer inquiries to determine which product categories trigger the most questions. If certain items are confusing, the company might refine product descriptions, introduce tutorial videos, or adjust its support policies.
Effective customer service hinges on internal knowledge-sharing, meaning agents need fast access to resources that help them resolve issues efficiently. This is another one of the common customer service analytics use cases.
As such, identifying and closing knowledge gaps that hinder service quality is one of the most pressing customer service analytics use cases.
Not every agent is an expert on every product feature or policy. Fortunately, analytics can show you where training is needed most.
Data from customer service analytics use cases reveals trends like:
For instance, if newer agents consistently escalate billing inquiries, targeted coaching can address the gap. Tools like timetoreply can show how specific agents perform under SLA pressure, giving insight into who might need process refreshers.
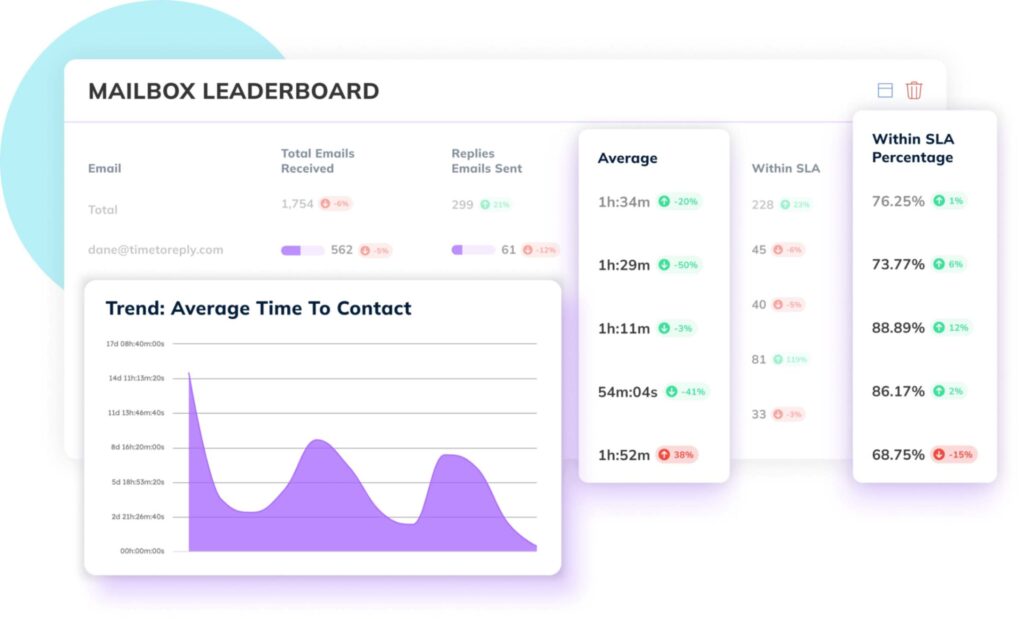
Image via timetoreply
Analyzing query patterns can also help you prioritize internal documentation development for maximum impact.
Among the most essential customer service analytics use cases is monitoring how customer satisfaction evolves across touchpoints, periods, or team shifts. Customer sentiment is constantly evolving, and businesses must keep up.
Monitoring survey results, direct feedback, and resolution efficiency can help you detect shifts in customer expectations. Instead of viewing satisfaction as a single snapshot, analytics lets you track key indicators like:
For example, a dip in CSAT scores after introducing a chatbot might prompt a re-evaluation of how it hands off to live agents. Conversely, if satisfaction improves when tickets are closed within 12 hours, that becomes a performance benchmark.
By analyzing the relationship between response patterns and satisfaction scores, you can identify exactly which service elements most significantly impact customer perception.
Also Read:
To effectively leverage customer service analytics, it’s essential to track and analyze the right metrics. These include first response time, resolution rate, CSAT, and more.
Let’s discuss some of the most important customer service metrics in detail
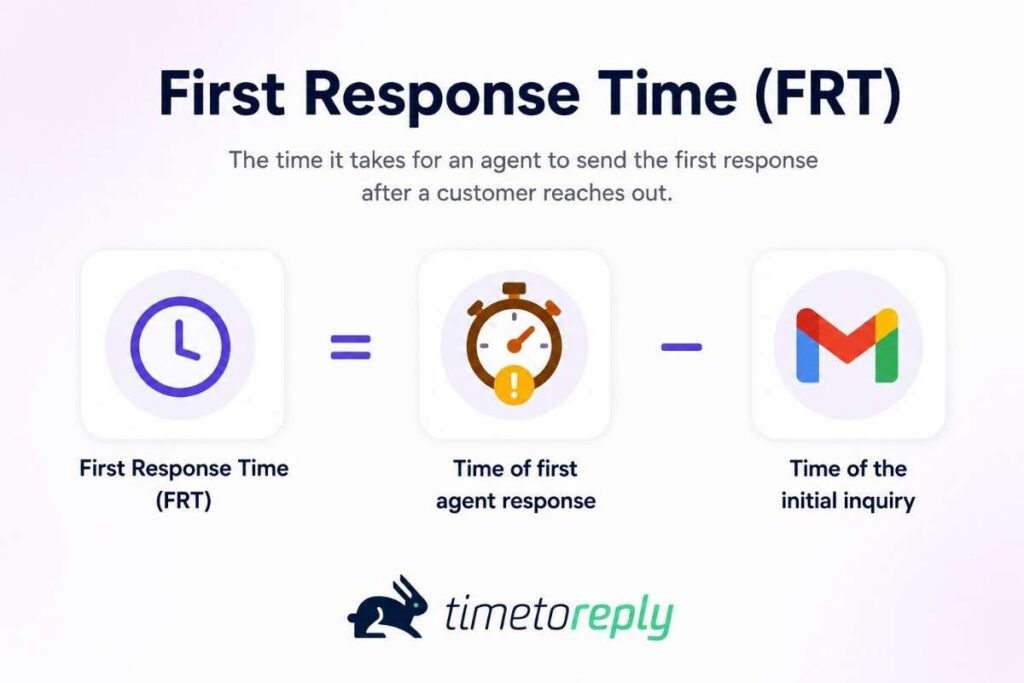
What it measures: The average time it takes for a customer to receive an initial reply after submitting a query.
| First response time = Time of first agent response – Time of the initial inquiry |
Why it matters: FRT is a strong indicator of responsiveness, one of the most visible aspects of customer service. Delayed replies, especially for time-sensitive issues, can lead to frustration and increased churn risks.
How to use it: Set SLA thresholds based on issue severity or channel. With tools like timetoreply, support teams can set alerts for slow responses and ensure timely action across live inboxes.
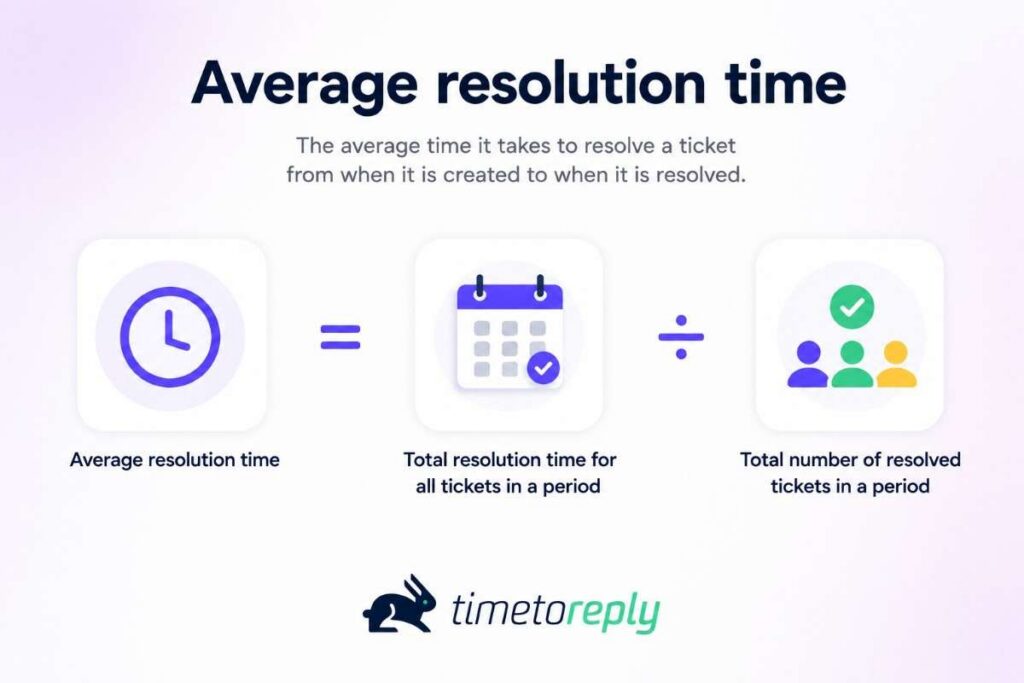
What it measures: The time taken to fully resolve a customer’s issue, from first contact to final closure.
| Average resolution time = Total resolution time for all tickets in a period ÷ Total number of resolved tickets in a period |
Why it matters: A prolonged resolution process frustrates customers and increases the likelihood of repeat inquiries. Long resolution times can signal complexity, knowledge gaps, or inefficient routing.
How to use it: Segment resolution time by issue type or agent to uncover trends. Reducing ART often requires better documentation, internal collaboration, or smarter ticket routing to the most qualified agents.

What it measures: Direct feedback from customers, typically collected through post-interaction surveys asking, “How satisfied were you with the support you received?”
| CSAT = (Number of positive responses ÷ Total number of responses ) * 100 |
Why it matters: CSAT is a core customer sentiment metric and a clear signal of perceived service quality. High scores indicate customers are pleased with the service, whereas low scores highlight pain points needing improvement.
How to use it: Combine CSAT scores with performance metrics like FRT and FCR to understand what drives satisfaction and dissatisfaction. You can also track CSAT by agent or team to guide coaching.
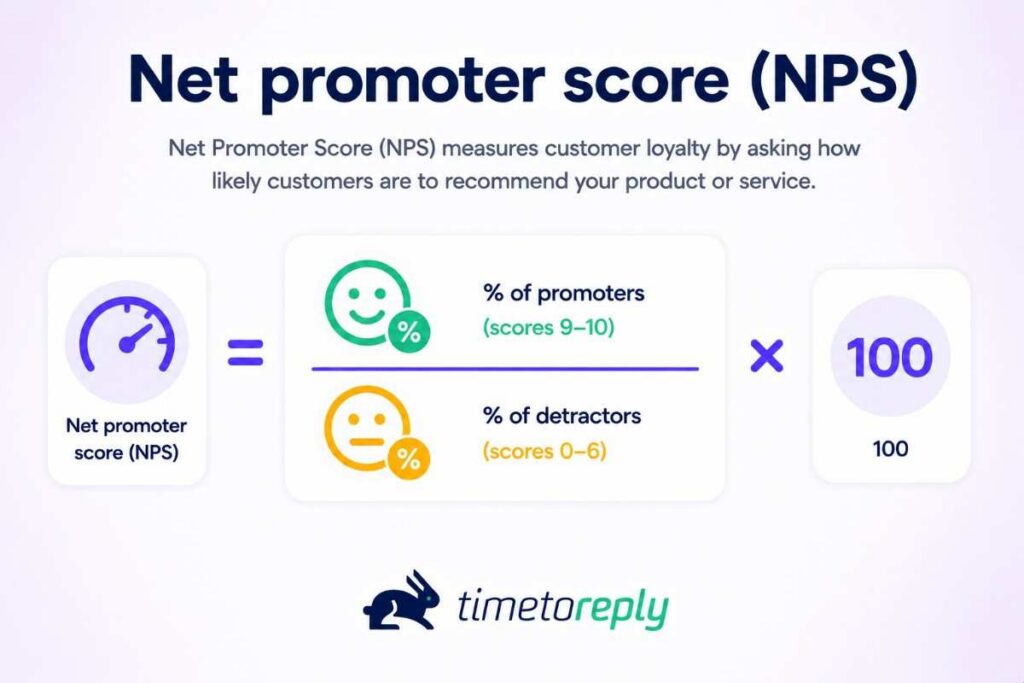
What it measures: Customer loyalty, based on the question, “How likely are you to recommend us to a friend or colleague?” The score is calculated based on the rating (0-10) that customers provide.
| Net promoter score = (% of promoter – % of detarctors) * 100 |
Why it matters: NPS is a broader metric than CSAT, capturing both support and overall brand perception. High NPS scores reflect stronger customer advocacy and consistent positive experiences over time.
How to use it: Segment NPS results by support channel or product type to find out where loyalty thrives or falls short. Where low, proactively address pain points, offer personalized support, and enhance follow-up strategies.
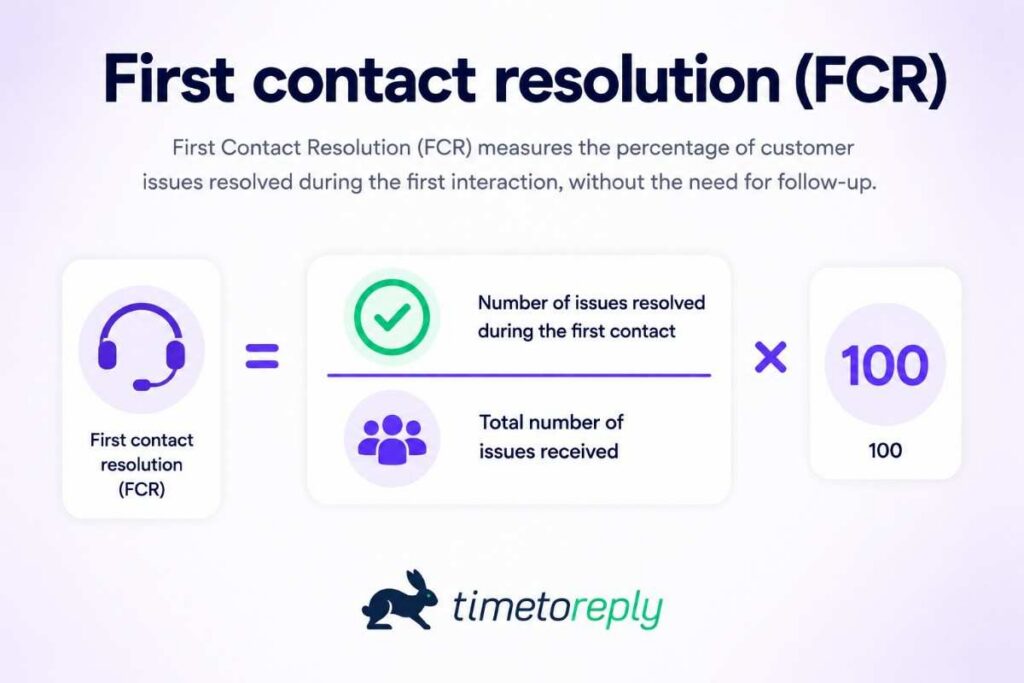
What it measures: The percentage of customer inquiries resolved during the initial interaction without requiring follow-up.
| FCR = (Total number of resolved on first contact ÷ Total number of issues received) * 100 |
Why it matters: FCR reflects your team’s ability to solve issues efficiently and completely. High FCR signifies effective problem resolution and service quality and correlates with increased customer satisfaction and reduced ticket volume.
How to use it: Low FCR may indicate training needs, poor access to knowledge bases, or unclear processes. Regular analysis can help address systemic barriers to swift resolution.
Also Read:
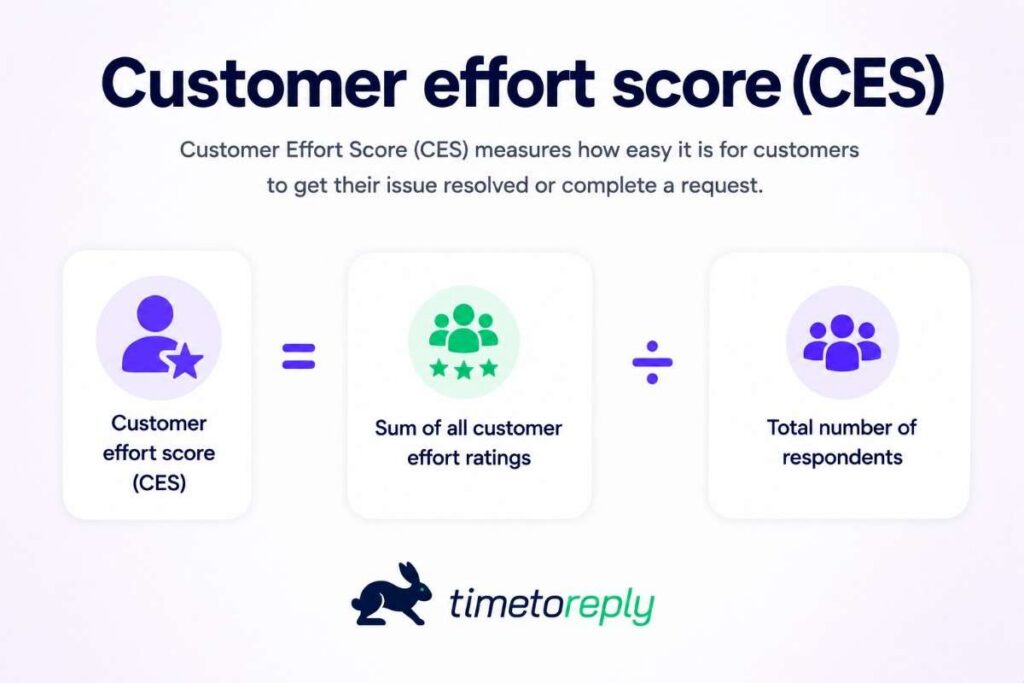
What it measures: How easy or difficult it is for customers to resolve their issues (usually rated on a 1-7 scale). The score is calculated as the average of all ratings divided by the total number of respondents.
| CES = Sum of all customer effort ratings ÷ Total number of respondents |
Why it matters: CES focuses on friction. Customers who experience a high-effort support process (long wait times, repeating information, multiple handoffs) are more likely to churn, even if their issue is eventually resolved.
How to use it: Use CES to identify where your support experience can be simplified, automated, or streamlined. Simplifying support workflows and optimizing self-service resources (like FAQs and AI-driven chatbots) can improve CES scores.
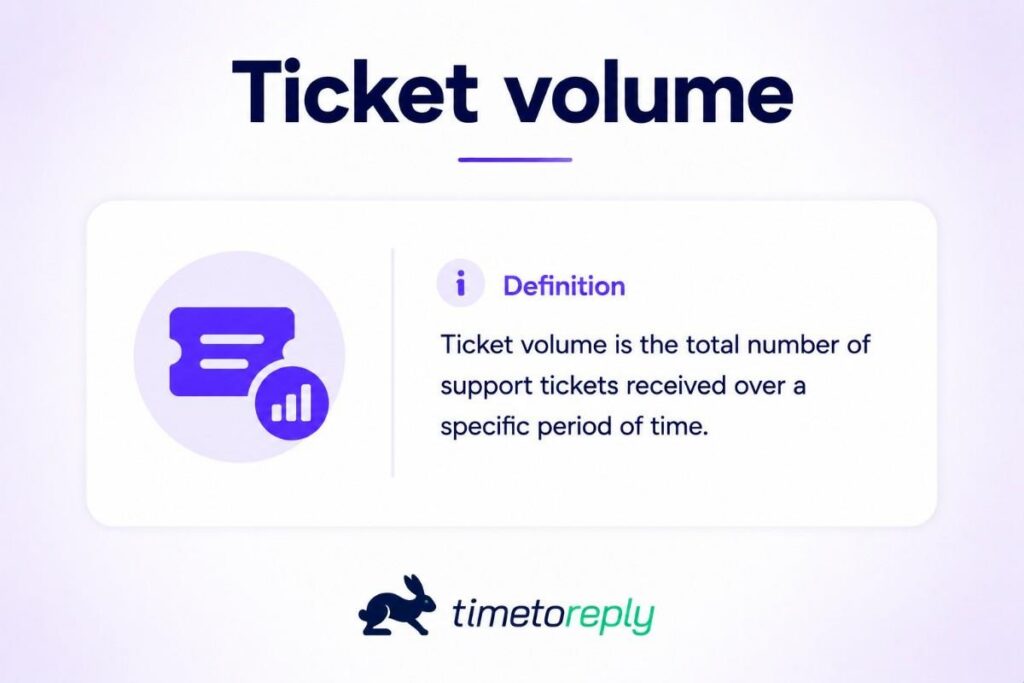
What it measures: The total number of support requests received during a specific timeframe.
Why it matters: While volume isn’t a quality indicator, sudden spikes can overwhelm your team and degrade response times. Monitoring volume is key to forecasting staffing needs and anticipating trends.
How to use it: Track ticket volume by day, channel, or category. Use historical data and predictive analytics to predict surges, like new product launches or billing cycles, and plan resourcing accordingly.
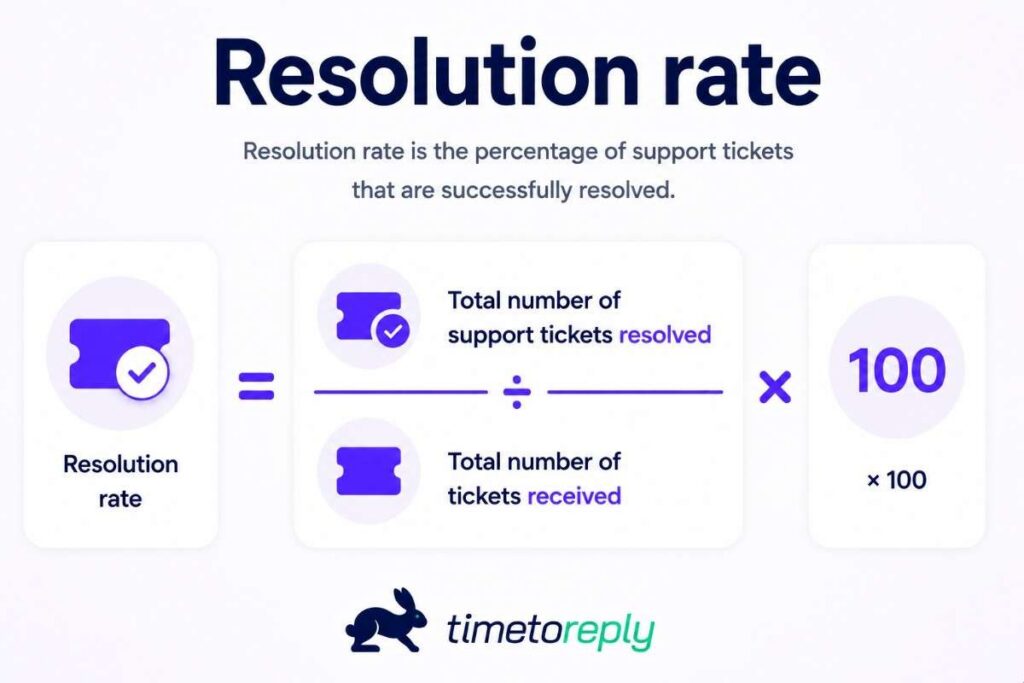
What it measures: The percentage of support tickets that are successfully resolved, either by agents or via self-service.
| Resolution rate = Total number of support tickets resolved ÷ Total number of tickets received |
Why it matters: A high resolution rate indicates operational efficiency and solid agent performance. Low resolution rates may suggest recurring technical issues, unclear documentation, or poor agent onboarding.
How to use it: Compare resolution rates across time periods or teams. Focus improvement efforts on underperforming categories or ticket types. Also, consider using AI-assisted ticket recommendations or providing agents access to customer history.
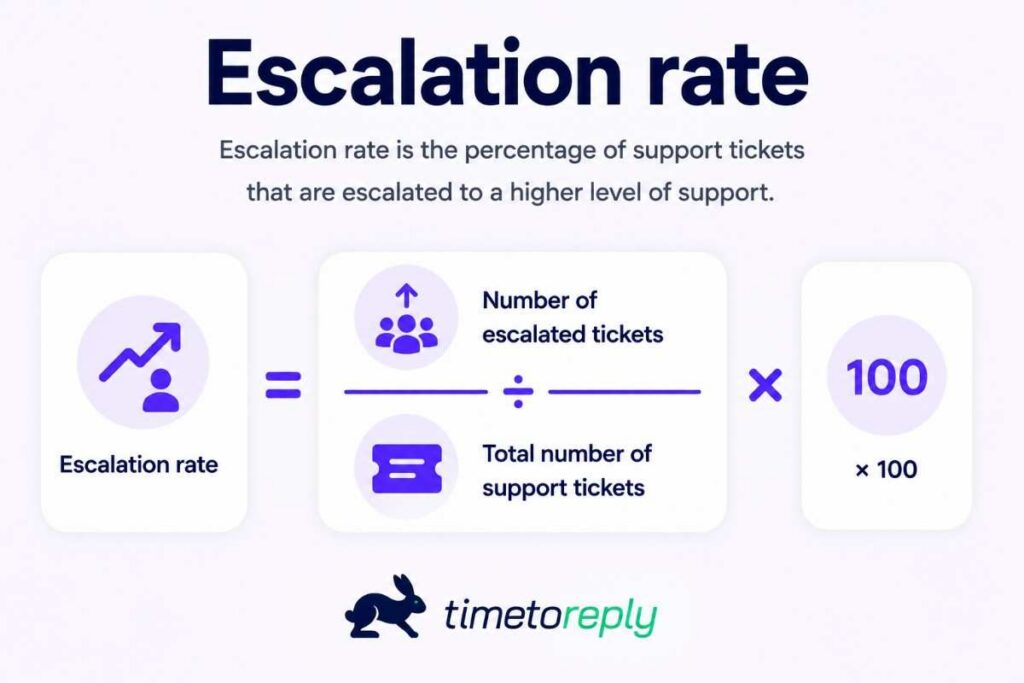
What it measures: The percentage of support requests that require intervention from a senior agent or manager.
| Escalation rate = (Number of escalated tickets ÷ Total number of support tickets) *100 |
Why it matters: Frequent escalations may point to customer complexity, frontline training, or knowledge gaps. High escalation rates are often tied to lower customer satisfaction and longer resolution times.
How to use it: Track escalation trends by agent or category to uncover training opportunities and improve documentation. Enhance internal collaboration and use AI-powered ticket routing to ensure complex issues reach the right experts faster.

What it measures: The percentage of customers who stop using a product or service over a given period.
| Customer churn rate = (Number of customers lost during a period ÷ Number of customers at the start of the period) * 100 |
Why it matters: While not a direct support metric, churn rate is a crucial KPI. Support interactions, especially poor ones, can significantly affect customer retention. A rising churn rate may indicate poor service experiences or a lack of proactive engagement.
How to use it: Cross-analyze churn with support data to uncover at-risk behaviors. For example, are customers with low CSAT or repeated tickets more likely to churn? Check low-resolution service trends and address your response time.
Also Read:
Customer service analytics becomes more useful when teams set clear goals first. It also helps to track customer sentiment and support quality together.
To make the most of customer service analytics, it’s essential to follow best practices that ensure accurate data collection, analysis, and actionable insights. Here are some key best practices to consider when implementing customer service analytics use cases.
Before diving into analytics, it’s crucial to establish clear goals and objectives for your customer service efforts. Determine what you aim to achieve through data-driven customer insights, such as reducing response times, improving satisfaction scores, or increasing resolution rates. Clear goals provide direction and focus for your analytics initiatives.
Accurate and comprehensive data collection is the foundation of effective analytics. Ensure you have reliable systems to capture relevant customer service data. Combine data from various channels — email, chat, phone, social media platforms — to get a comprehensive view of customer interactions. Utilize customer service software solutions that automate data collection to minimize errors and save time.
Use tools like timetoreply that provide real-time data and insights to address issues as they arise. Real-time analytics help in making immediate improvements and reacting swiftly to customer needs.
Consistent monitoring and analyzing key metrics are essential for identifying trends and patterns. Set up regular reporting schedules to track your support team’s performance and customer satisfaction levels. Use dashboards and visualizations to make data analysis more accessible and actionable.
Here’s what timetoreply’s agent performance dashboard looks like, for example.
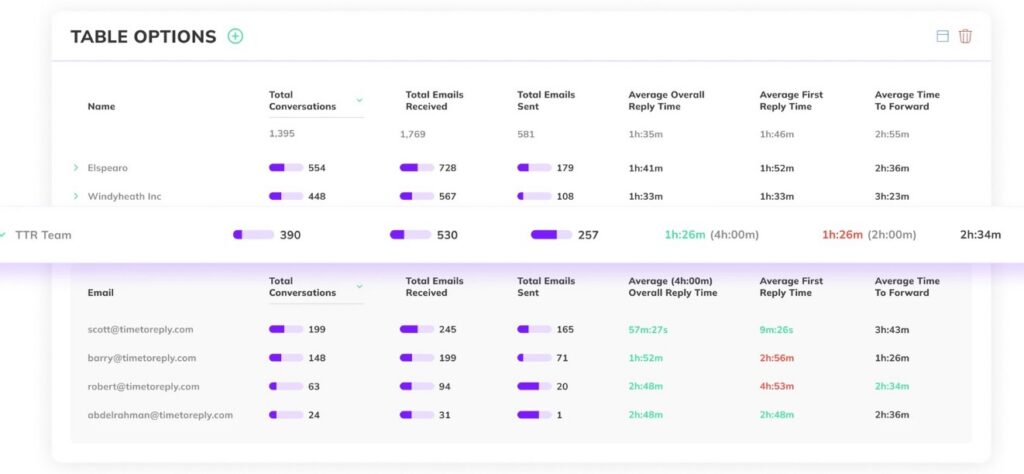
Image via timetoreply
Creating a data-driven culture within your support team is crucial for successfully implementing analytics. Encourage team members to leverage data in their decision-making processes and provide training on using analytics tools effectively. A data-driven mindset ensures that everyone is aligned with your analytics goals and actively contributes to continuous improvement.
Compare your metrics with industry benchmarks to understand how you stack up against competitors. This perspective can highlight areas for improvement and inspire best practices.
Use analytics to track and analyze customer feedback. Actively seeking and incorporating feedback helps in refining your service and addressing customer concerns effectively.
Customer service analytics is an ongoing process that requires continuous refinement and adaptation. Regularly review your metrics, goals, and strategies to ensure they remain relevant and aligned with your business objectives. Stay updated on industry trends and advancements in analytics to keep your approach innovative and effective.
Also Read:
Implementing customer service analytics use cases becomes difficult when support data is spread across different systems. Inaccurate reporting and growing ticket volume can also create problems for support teams.
There are several challenges you must overcome to use customer service analytics effectively. Let’s discuss some of the most common ones.
One of the biggest roadblocks to successful analytics is fragmented data. Customer interactions often span multiple channels, including email, chat, phone, CRM databases, and social media platforms, each managed by a different platform.
This fragmentation makes comprehensive analytics nearly impossible. Without centralized visibility, it becomes difficult to generate holistic customer insights.
Solution: Break down silos by integrating customer service analytics tools with CRM platforms, AI-driven dashboards, and omnichannel tracking systems.
Modern analytics platforms offer API connections to popular support tools, allowing unified data collection without massive IT projects. Remember, data centralization is key to generating accurate, actionable analytics across your support operation.
The timetoreply analytics platform, for example, integrates with major CRM platforms like HubSpot and Salesforce. It also allows integrations via Zapier.
Image via timetoreply
Inconsistent or outdated tracking methods, technical glitches, and human error can compromise data quality, leading to misguided decisions and diminished trust in analytics systems.
Even with integration, poor tracking practices can compromise your data. Inaccurate timestamps, missing tags, or miscategorized tickets can lead to skewed conclusions.
Solution: Invest in automated tracking solutions that standardize data collection across customer touchpoints. Also, establish clear data governance practices and standardized definitions for all key metrics.
Consider temporarily running parallel tracking systems to validate results before making significant decisions when you launch new analytics initiatives. Periodic audits of your reporting setup can help catch issues before they snowball.
Sometimes, teams collect data diligently, but it doesn’t lead to meaningful improvements. Reports pile up, but getting teams to embrace data-driven decision-making becomes a major pain.
Some agents might resist analytics-based performance assessments, fearing excessive monitoring or unrealistic targets. Similarly, leadership teams may hesitate to prioritize analytics investments due to budget constraints.
Solution: Hold transparent discussions about how metrics impact workflow optimizations. Focusing on the bigger picture, instead of just evaluating individual performance, helps build agent buy-in.
Additionally, shift the focus from vanity metrics to outcome-driven insights. Don’t just measure how many tickets were resolved; analyze how resolution times correlate with satisfaction scores.
As businesses scale, the volume of customer data grows exponentially. What worked for a small team of five quickly becomes unmanageable for a support department of fifty.
Without a streamlined analytics infrastructure, you may struggle to maintain service consistency, leading to delays and lower satisfaction rates.
Solution: Adopt scalable analytics platforms that expand with your needs, whether through AI-powered reporting, machine learning-driven automation, or customizable dashboards.
Automate wherever possible, from ticket tagging to performance reporting, so that managers can focus on strategy rather than manual compilation. Also, consider setting up alerts for threshold breaches (like service SLAs or satisfaction dips) so issues are flagged before they become critical.
Also Read:
1. How are analytics used in customer service?
Customer service analytics use cases span operational improvement, strategic planning, and customer experience enhancement. Customer service teams use analytics to monitor response times, track resolution rates, identify training needs, and predict future service demands.
Organizations can identify bottlenecks, optimize staffing, and improve service processes by collecting and analyzing interaction data. For example, email analytics tools like timetoreply help teams track response patterns and set up automated alerts when messages approach SLA thresholds.
2. What is an example of customer data analytics?
A common example of customer data analytics in service settings is tracking customer satisfaction (CSAT) scores after each support interaction. This data can be segmented by agent, channel, or issue type to identify what drives satisfaction or dissatisfaction.
Another example is using historical ticket volume data to predict support surges during product launches or seasonal spikes and prepare resources accordingly.
3. How do customer service analytics improve customer experience and satisfaction?
Analytics provide clear visibility into support performance and customer sentiment. Companies can reduce response times, increase resolution efficiency, and personalize support experiences by analyzing service data. This leads to faster, more satisfying interactions, ultimately boosting customer loyalty and retention.
One of the key customer service analytics use cases is tracking satisfaction trends. Organizations that monitor CSAT scores, Net Promoter Scores (NPS), and Customer Effort Scores (CES) are better placed to refine service strategies and enhance the overall customer experience.
4. What customer service key performance indicators (KPIs) should you prioritize?
While specific KPI priorities depend on business goals, the most impactful customer service analytics typically focus on response time, resolution quality, and satisfaction metrics. Some of the most critical metrics include:
These metrics form the foundation of most customer service analytics use cases, helping managers pinpoint inefficiencies and optimize team workflows. Customer effort score (CES) and churn rate are valuable for long-term strategy.
5. Can small teams benefit from customer service analytics?
Absolutely. Customer service analytics aren’t just for enterprise-level teams. Small businesses can leverage customer service analytics use cases to optimize their operations.
Tools like email performance tracking, AI chatbots, and sentiment analysis enhance efficiency, helping teams scale, close knowledge gaps, and maintain high-quality service without unnecessary overhead.
6. What tools help track customer service analytics in shared inboxes?
Shared inbox teams need tools that can track response times, ticket volume, and team activity in one place. The best tools also make it easy to spot slow replies and missed SLAs. The timetoreply tool helps support teams do that with live inbox tracking and clear performance data. It’s useful across various customer service analytics use cases.
7. How often should support teams review customer service analytics reports?
Support teams should review key reports daily or weekly, depending on ticket volume. Fast-moving teams may need daily checks, while smaller teams can review trends weekly. Tools like timetoreply help by showing live response data, so managers can spot issues before the next report.
8. Which customer service metrics matter most for email support teams?
Email support teams should focus on metrics that show speed and quality. First response time, average resolution time, CSAT, and SLA compliance are usually the most important.
Use timetoreply to monitor email performance metrics without hassle. It works within your inbox and delivers insights without changing your workflow. So, use it for various customer service analytics use cases.
Also Read:
Customer service analytics use cases help teams turn support data into clear action. They show where replies slow down, where tickets pile up, and where customers start to lose patience. That makes it easier to improve customer service without guessing.
The best teams do not just collect reports. They use the numbers to fix real problems in speed, quality, and workload.
The timetoreply tool helps by tracking response times, inbox load, and SLA risk in real time. Book a demo for timetoreply to see how it can help your team stay on top of support performance.
Get live inbox alerts and reply quickly to customer emails with timetoreply

Head of Customer Success @ timetoreply
Barry Blassoples is the Head of Customer Success at timetoreply, where he helps customer-facing teams boost revenue and protect brand reputation by providing actionable insights to improve their business email response times. He has over 15 years of leadership experience across customer success, sales, and marketing roles in high-growth tech companies.


Trusted by high-performing inbound sales teams and customer-facing teams globally.
Close more deals and delight more customers with the faster, smarter, deeper email analytics and performance optimization software that works straight from your team’s inbox.