
A request can receive a response within the SLA while the underlying issue remains unresolved. That’s why response and resolution times need separate targets and measurements.
This guide explains how SLA response time works, how to set realistic targets, and how email teams can measure performance without a ticketing system.
SLA response time is how long a team has to reply to a customer request under an agreed SLA. The clock starts when the request arrives, and the SLA defines what counts as a response. The commitment sits in a service level agreement, which sets the service standards between provider and customer.
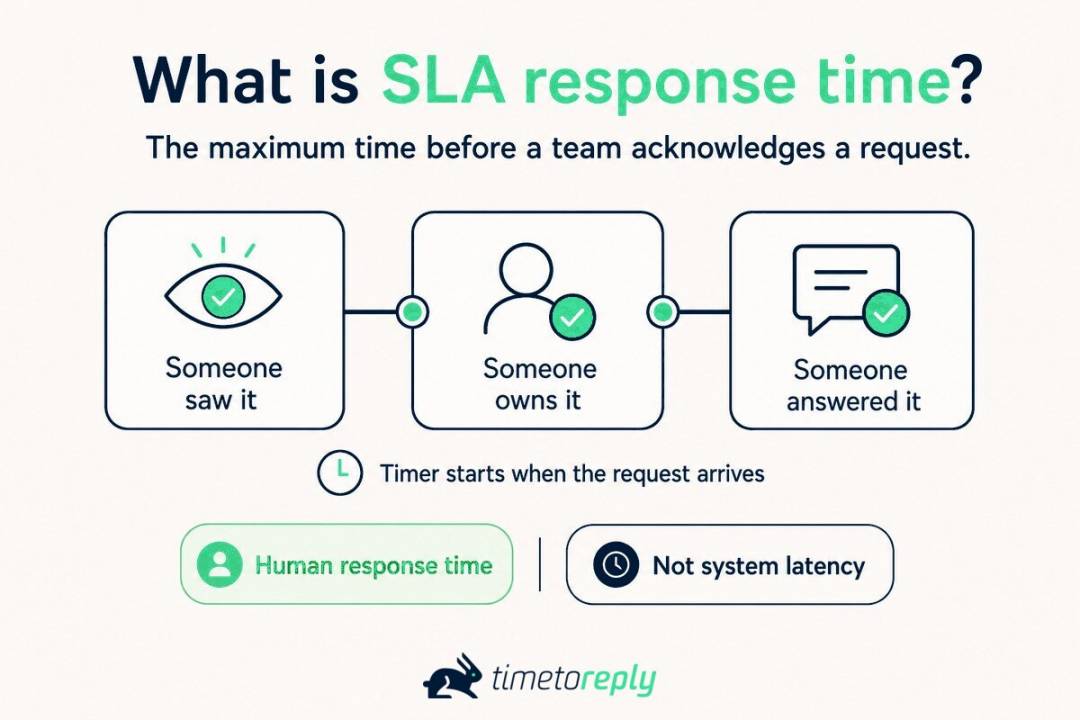
A response-time promise has three separate parts: receipt, ownership, and response. The SLA puts a measurable limit on the final step, while the other steps can still affect customer experience.
You may also see this described as response SLA time. In this context, it means how long a customer waits for a reply, not technical system latency.
Response time can also mean technical latency. In engineering, it may describe how fast a system handles a request. This guide uses the customer-service meaning.
SLAs can also take different forms. A service-based SLA covers all customers using one service, while a customer-based SLA covers one account. A multi-level SLA combines service and customer requirements, which can create different response targets.
SLA response time measures how quickly a team sends a qualifying response. Resolution time measures how long it takes to solve the issue. First response time measures how long it takes to send the first human reply. Teams shouldn’t treat these metrics as the same.
| Metric | What it measures | When the clock stops |
| Response time | Time until someone provides the agreed response | When the SLA’s response condition is met |
| Resolution time | How long before the underlying problem is fixed and closed | When the issue meets the agreed resolution condition |
| First response time | Time till the first human reply reaches the customer | When the first agent or human reply is sent |
| System response time | Machine latency when processing a request | When the system completes the request |
The exact definitions can vary between support platforms and SLAs. Your agreement should define each metric and its stop event to prevent disputes.
The response clock starts when the request enters the agreed service channel. It shouldn’t start when someone opens, assigns, or begins working on the request. The SLA should also specify when the clock stops.
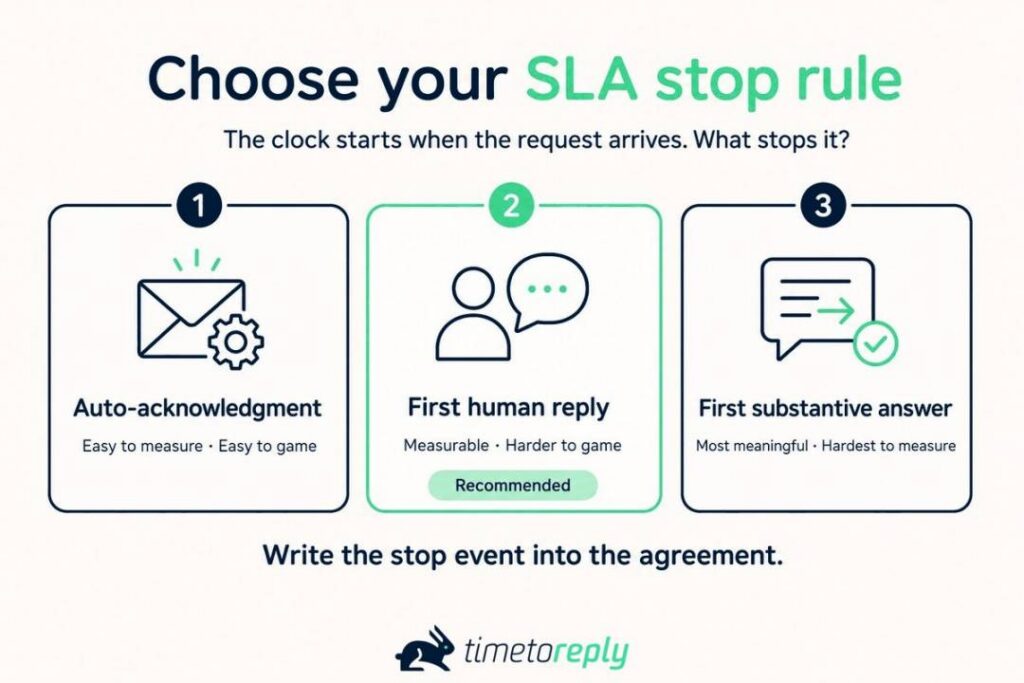
Teams typically use one of three stop events:
For most customer-facing teams, the first human reply provides the clearest response-time measure. It shows that someone has engaged with the request without requiring the issue itself to be resolved.
Whatever rule you choose, put it in the SLA. A response target has little value if customers and teams interpret “response” differently.
It’s the agreed time limit for providing a qualifying response after a customer request arrives. The SLA should define both the start event and what counts as a response. Resolution time measures the separate process of fixing the issue.
Also Read:
SLA response time turns a vague service expectation into a measurable commitment. It gives customers a clear expectation and gives teams a target they can staff, coach, and report against.
Giving customers a response time they can hold you to ensures accountability. Speed isn’t just a preference when responsiveness affects the buying decision.
Zendesk’s CX Trends 2026 research surveyed more than 11,000 consumers and business respondents. It found that 86% of consumers say responsiveness and accurate resolution strongly influence purchase decisions.
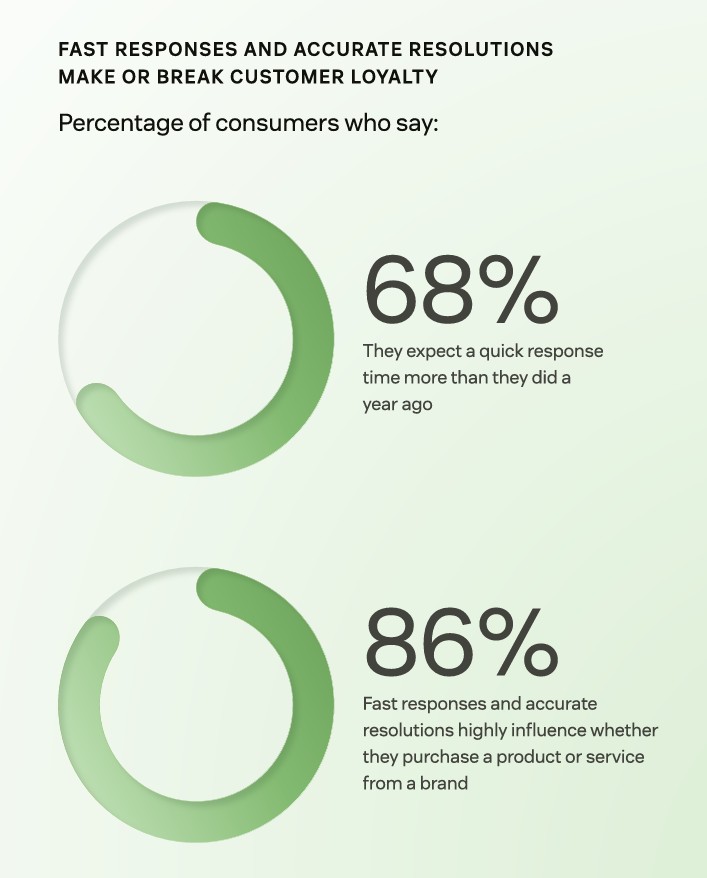
Image via Zendesk
The same study found that 85% of CX leaders believe one unresolved issue can lose a customer. A clear response target helps teams spot this risk early.
SLA response time gives managers something concrete to manage.
A shared target helps them spot delays, coach teams, and measure progress. Telarus, for example, cut response times in particular groups from seven hours to two by improving its support process.
Response time is a service floor, not a measure of service quality. A fast reply doesn’t prove that the customer received a useful answer.
Response time works best alongside other customer service metrics. Resolution time shows how quickly issues close, while first contact resolution shows whether one interaction solved the issue.
Breach rate shows how often teams miss their response target, while volume shows the workload behind those results. Together, these measures form a more useful customer service metrics set.
Response time can be both an SLA and a KPI, depending on how you use it.
The SLA sets the commitment, while the KPI tracks performance against it. Customer experience analytics can connect response speed with broader customer satisfaction trends.
It sets a clear response target that teams can track. Customers know when to expect a reply, and managers can measure team performance.
Also Read:
An SLA response-time clock defines the start event, which hours count, and the stop event. Priority then determines the target that applies to each request. Define these elements clearly, or teams may calculate the same SLA differently.
Priority tiers assign different response targets to different types of requests. A critical outage might require a response within minutes, while a general question could allow one business day.
The bigger challenge is defining which hours count toward the target. A response target based on calendar hours won’t work if the team only staffs business hours.
Here’s how the response clock typically works:
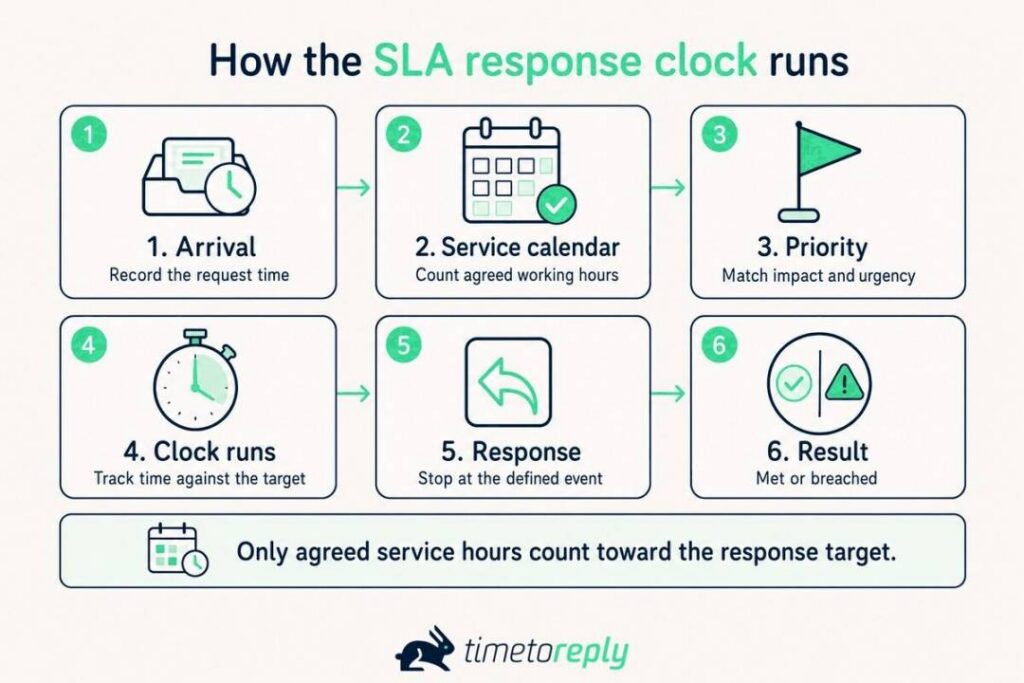
Business hours can produce very different results from calendar hours.
Say a 5:55 p.m. email receives a reply at 8:05 a.m. the following day. Assuming your company operates between 8 a.m. and 6 p.m., the elapsed business-hours time is only ten minutes.
Priority rules should be clear. Impact measures how much an issue affects the business. Urgency measures how quickly it needs action. A serious issue that can safely wait isn’t automatically a P1.
Your SLA should define what happens when customers delay the process or reopen a request. Common cases include waiting for customer information, duplicate follow-ups, and reopened threads.
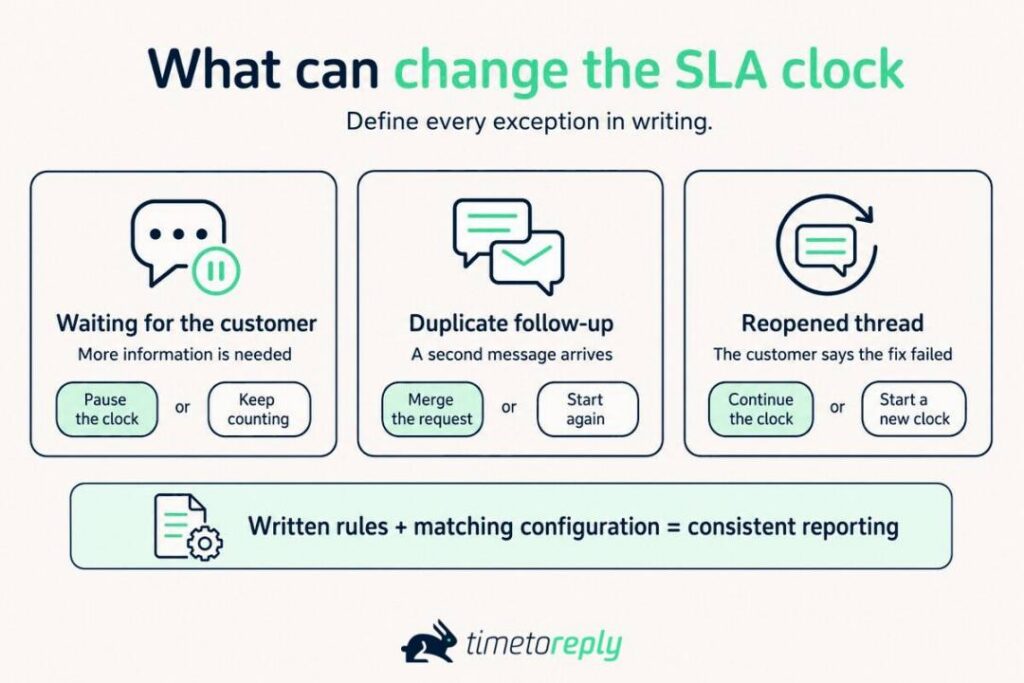
Customer waiting time needs an explicit rule. If that time pauses the SLA, define exactly when the pause starts and ends. If it doesn’t, the customer’s delay remains part of your team’s response time.
Reopened threads need a similar rule. If a customer replies three days later, decide whether to start a new clock or continue the original one.
Your setup should follow these rules. Otherwise, email analytics can produce results that teams interpret differently.
The same applies to SLA monitoring. Monitoring can only measure the rules you’ve configured. So, ambiguous exclusions will produce ambiguous results.
It starts at an agreed event, counts only the defined service hours, and stops at a qualifying response. Priority determines the target, while pauses and exclusions determine which time counts.
Also Read:
A good SLA response time depends on your customers, request volume, support hours, and priority levels. No universal target works for every team.
The practical approach is to compare published figures against your own performance data, then set targets from there.
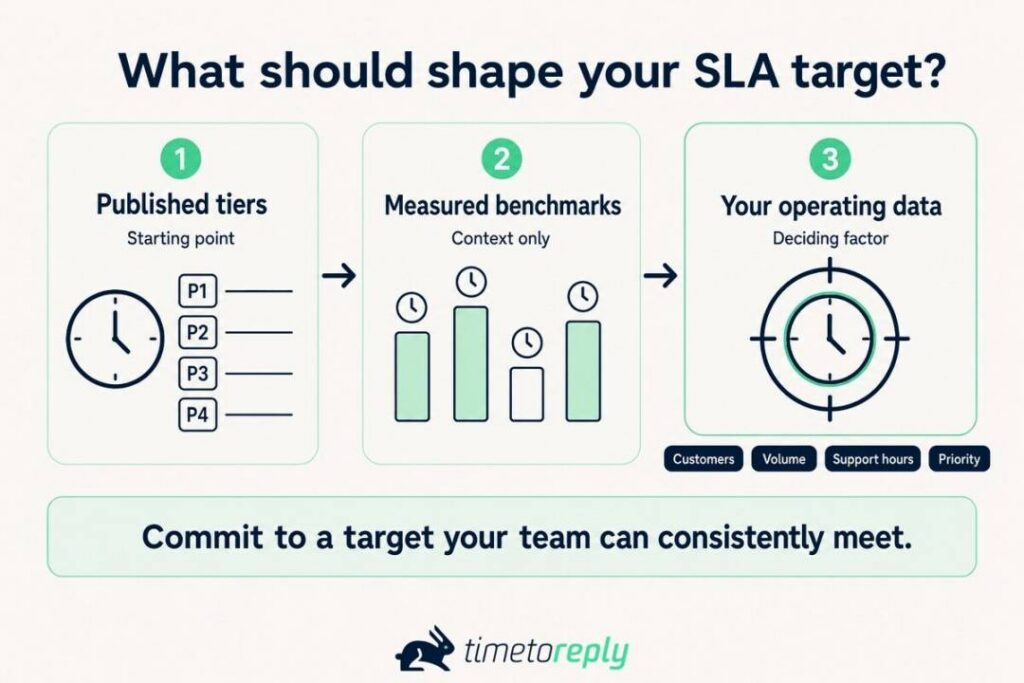
There isn’t a universal response-time target for each priority level.
Published examples commonly use ranges like these:
Treat these figures as starting points, not fixed standards. They appear often in published guides, but no standards body sets these exact targets.
Publicly accessible ITIL 4 and ISO/IEC 20000-1 guidance doesn’t establish universal response targets. Instead, service-level targets are agreed between providers and customers based on the service being delivered.
The takeaway: start with published tiers, then use your own data. Your customers, staffing, support hours, request volume, and priority rules should shape the final targets.
Also read:
Published benchmarks vary widely because organizations measure response times differently. Work hours, elapsed time, averages, medians, industries, and channels can all change the reported figure.
| Source | Population | Figure | Measurement basis |
| EmailAnalytics benchmark report, 2026 | 25,384,649 emails, 22 industries, Q2 2026 | 4h 10m | Average work hours (12h 55m elapsed) |
| Freshservice Benchmark Report, 2025 | 187M+ tickets across 10,551 organizations | 9.36 hours | Average first response, IT |
| Freshservice Benchmark Report, 2025 | Same dataset, non-IT service teams | 13.30 hours | Average first response, HR, finance, facilities |
| Fixify help desk benchmark, 2026 | 50,000+ tickets, 30+ organizations | 5 minutes | Median response for Fixify’s IT help desk customers |
| Gorgias research, 2026 | Ecommerce merchants across 14 verticals | 6.3 hours | Median response for merchants at $10M annual gross merchandise value |
These figures aren’t directly comparable because their populations and methods differ. A 9.36-hour average and a five-minute median don’t indicate conflicting levels of service. They measure different groups and use different definitions.
SLA attainment provides a more useful comparison because it measures performance against a defined target. Ontellus increased the share of emails answered within eight business hours from 62% to 86%, against a 95% target.
That result is a point-in-time outcome from one organization, not an industry benchmark. However, it shows why SLA compliance is easier to act on than an average response time.
An average tells you how quickly responses arrived overall. An attainment rate tells you how often responses met the agreed window.
Also Read:
An industry average can hide large differences between teams, even within the same sector.
Gorgias measured first response times across 14 ecommerce verticals and found a 5.5x gap. Hardware brands averaged 1.6 hours, compared with 9.1 hours for arts and entertainment brands.
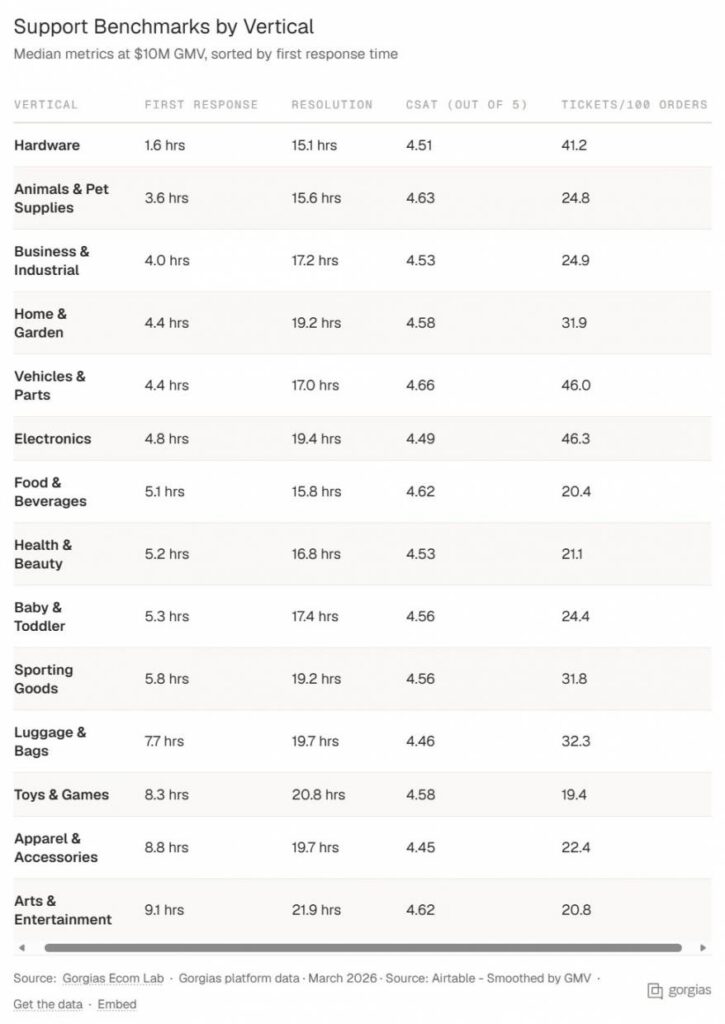
Image via Gorgias
Real teams can also perform far outside published benchmarks. Plus Packaging reported a 33-minute average response time in November, according to its 2023 case study.
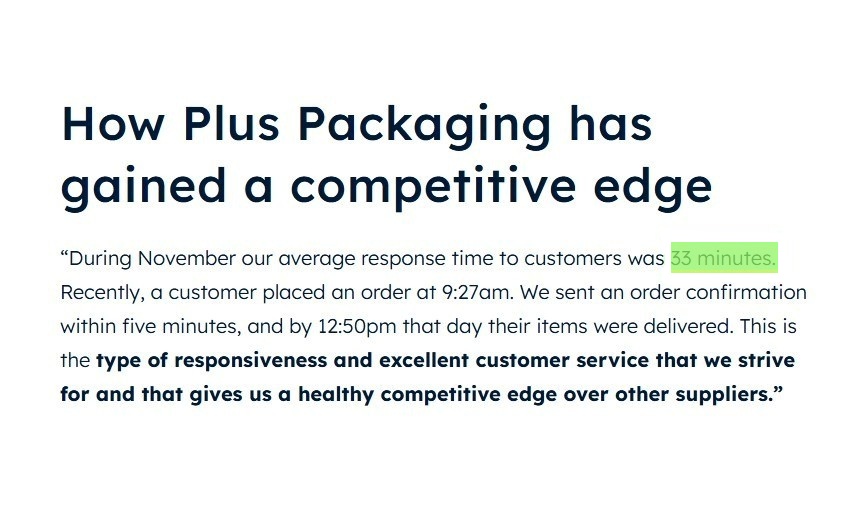
Image via timetoreply
Business function matters as much as industry.
A sales team handling inbound leads operates on a different clock from a support team. That’s why lead response time often needs a tighter target than general customer support.
So the answer to “what’s a good SLA response time?” is the target your own data supports and your team can consistently meet.
Published tiers provide a starting point, while benchmarks provide context. Your own response-time distribution should determine the commitment.
For more context, see our guide to average email response time.
A good target reflects your response data, customer expectations, and service capacity. Published tiers offer useful context, but they’re not fixed standards. Your own data should guide the target you set.
Also Read:
Measure SLA response time as a distribution, then report how often requests meet the target. Averages can hide slow responses, while percentiles show how the response-time tail behaves.
An average can hide slow replies because a few fast responses can pull the number down. Percentiles show how many customers experience delays.
Commit to “two hours on average” and a good Monday will absorb a bad Friday. But make it “90% within two hours,” and every slow reply counts.
A help desk benchmark illustrates the difference: a low median response time can still hide slower replies at the 90th percentile.
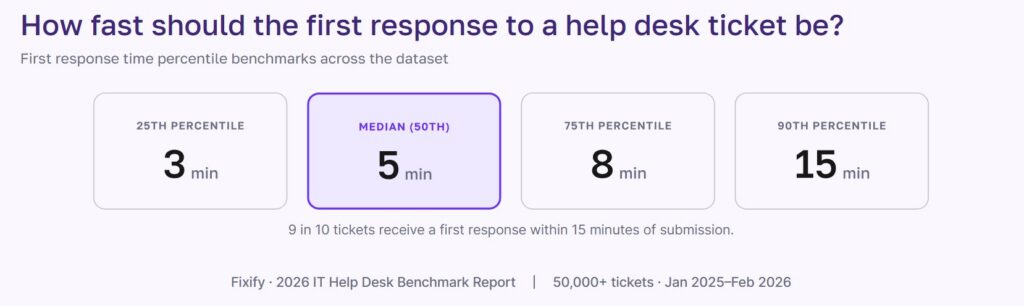
Image via Fixify
A customer example shows why both measures matter. One supplier averaged 45 minutes with a 5% breach rate. Another averaged 6.5 hours with breaches above 50%.
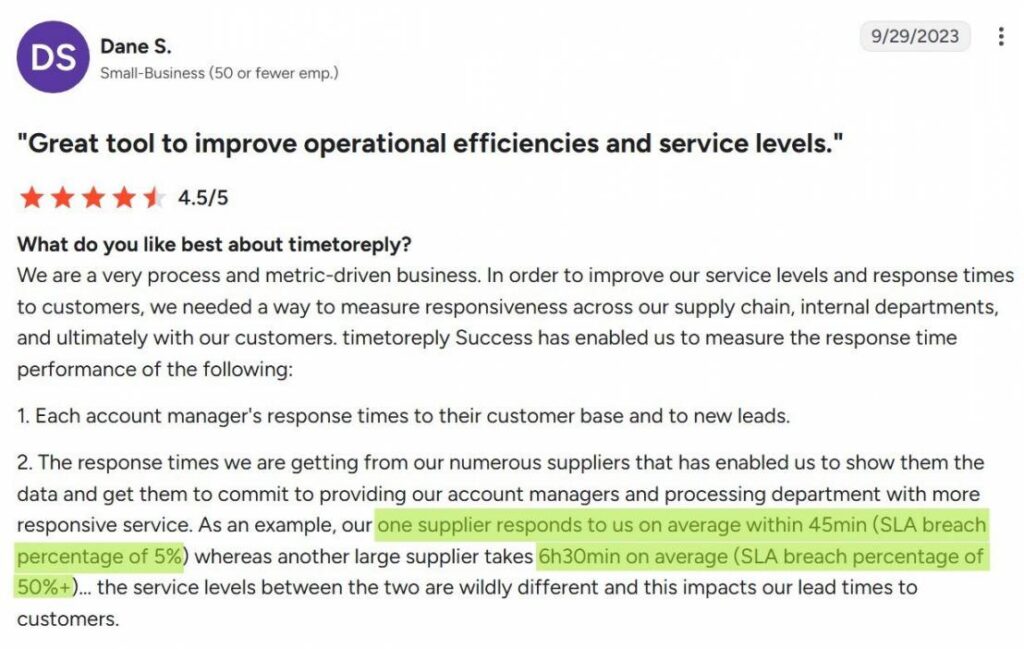
Image via G2
The averages show a large performance gap, but the breach rates show how often each supplier missed its commitment. A target such as “90% of first replies within two business hours” makes the required performance clear.
That approach also supports measuring customer experience by keeping slow responses visible.
Also Read:
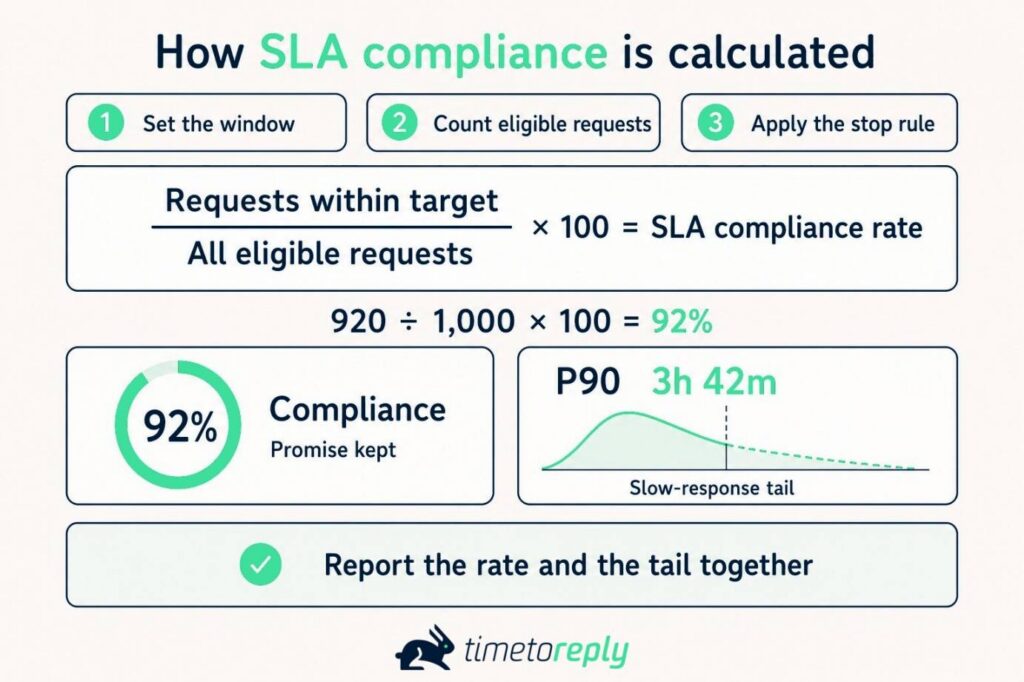
Divide the number of requests answered within the SLA by the total number of eligible requests. Multiply the result by 100 to get your SLA compliance rate.
This figure shows how often your team meets its response-time target. Set clear rules for which requests count and which exclusions apply.
Use these steps:
Freshservice’s 2025 benchmark reports resolution SLA adherence of 96.16% for IT teams and 94.2% for non-IT teams. Those figures measure resolution, not first response, so they aren’t response-time benchmarks.
We found no comparable published first-response attainment benchmark based on broad vendor data. That’s why your own compliance rate should use clearly defined inputs and exclusions.
For more detail on breach handling and reporting cadence, see our guide to SLA compliance.
Report both compliance and response-time distribution together. The rate shows whether you kept the promise, while the percentile shows what slower customers experienced.
Measure response times across the full range, not just the average. Report SLA compliance alongside the median and 90th percentile.
Also Read:
Email teams without ticketing systems can measure SLA response time from message timestamps. Start by defining the clock and stop event, then measure current performance before setting a target.
This approach works without creating a ticket for every request. It also avoids choosing a target before you know what your team can achieve.
The start event already exists in the message. Every inbound email carries a received timestamp in its header, and every reply carries a sent timestamp. Subtracting one from the other gives you response time per message.
This works the same way across Outlook, Microsoft 365, Gmail, and Google Workspace. The received timestamp comes from your mail server, not the customer’s device. This matters when you’re working across time zones.
Manual tracking can establish a baseline, but it becomes difficult as mailbox volume grows. Email response time tracking software can automate measurement and reporting.
Satguru Travel illustrates how an email team can turn that measurement into a target. Its 2024 case study describes a goal of answering 60% of emails within 30 minutes and every email within four hours.
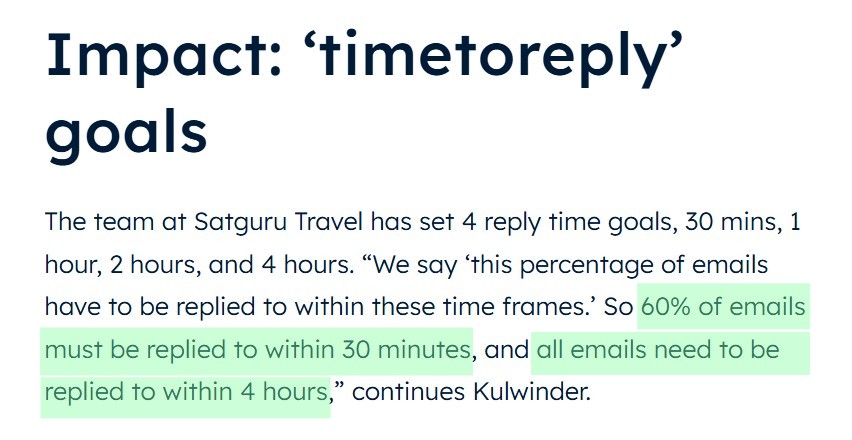
Image via timetoreply
Shared mailboxes require clear rules for ownership and message counting. Several teammates may see the same request, and customers often send follow-ups before anyone responds.
Decide whether to track individual messages or customer threads. Thread tracking can hide delays when customers send multiple follow-ups. Message tracking shows each message that remains unanswered.
Keep the method consistent over time. Otherwise, changes in email management can make performance trends difficult to interpret.
Next, define who owns the response. You can assign messages when they arrive, when someone opens them, or through round-robin routing.
The specific ownership method matters less than having a clear rule. Without one, shared mailbox data can’t reliably show who was responsible for the response.
Also Read:
An auto-acknowledgement can count as a response if the SLA explicitly defines it that way. For a human-response SLA, the timer should keep running until someone responds.
An automated reply only confirms that a message was sent. It doesn’t show that a team member handled the request. Auto-replies can still set expectations and reduce follow-ups.
Define this rule before you start measuring performance. Otherwise, a strong response-time result may reflect automation instead of human replies.
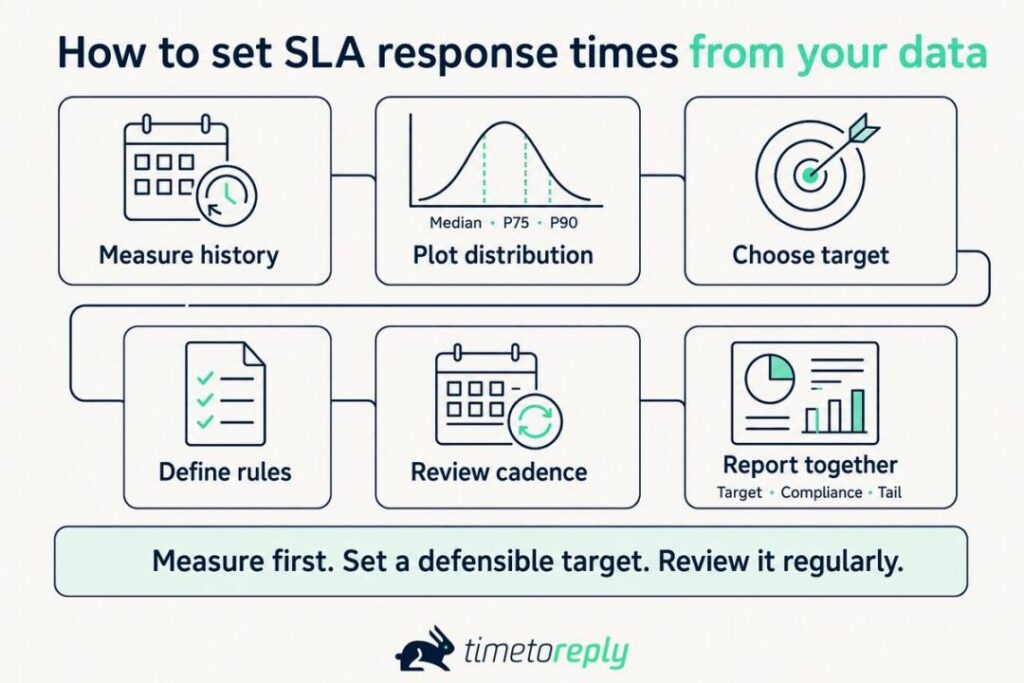
Your team’s response-time data is a better starting point than any external average. Measure performance first, choose a defensible target, then document and review it.
Lead Forensics shows how a defined benchmark can drive improvement. The company set a two-hour acknowledgement target and later cut average reply time from four hours to under two.
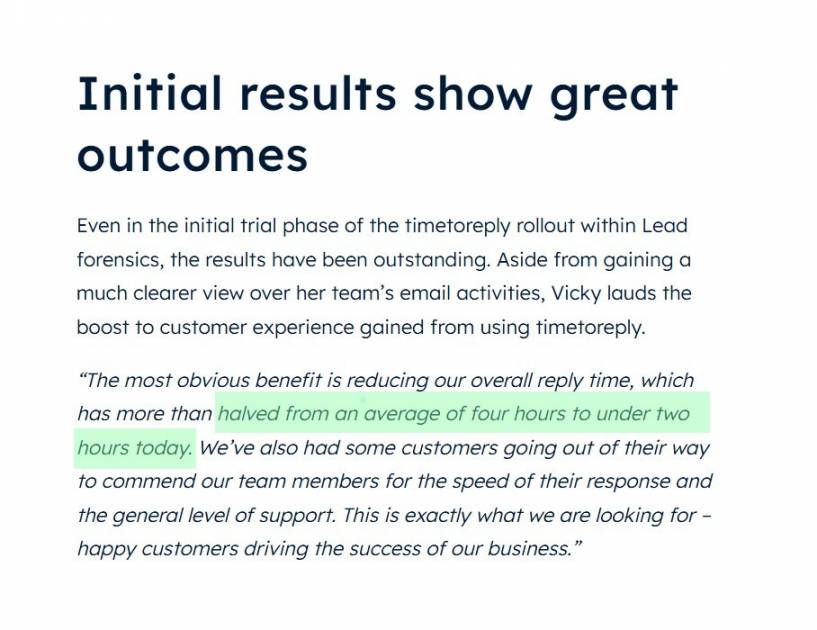
Image via timetoreply
The lesson is simple: measure first, then set a target your current data can support. You can tighten that target as performance improves, using data to improve reply times.
Define when the clock starts and stops. Review your team’s current response times, then set a target it can meet. Document service hours and exclusions, and review results regularly.
Also Read:
SLA response-time targets usually fail because teams measure the wrong outcome or don’t manage the target. Four problems appear often: optimizing speed alone, using one target for everything, ignoring breaches, and failing to review the target.
Verint’s State of Customer Experience 2026 surveyed 5,000 US consumers. It found that 79% would switch after one negative experience. Meanwhile, 78% prioritize the fastest resolution over their preferred channel.
Speed without outcomes, blanket targets, ignored breaches, and stale rules are the most common causes. A useful SLA needs clear targets, ownership, escalation rules, and regular review.
Also Read:
1. What does SLA response time actually measure?
It measures how long a customer waits for a qualifying response. The clock starts when the request arrives and stops at the response event defined by the SLA. This event is usually the first human reply.
2. Is there a standard SLA response time?
No. Neither ITIL 4 nor ISO/IEC 20000-1 sets a numeric response-time target. Common tiers, such as 15 minutes to one business day, are industry conventions.
3. What’s the difference between response time and resolution time?
Response time is how long before someone confirms a request has landed. Resolution time is how long before the problem is actually fixed. Each metric has its own start and stop events.
A team can meet its response target while taking much longer to resolve the issue. That’s why SLAs often track both.
4. What does a four-hour SLA mean?
It usually means the team must respond within four hours. Check whether the agreement covers business hours or calendar hours. A Friday-afternoon start can push four business hours into Monday.
5. What does a three-day SLA mean?
Three days to respond or resolve, depending on the agreement. Business days or calendar days also matter. A weekend or holiday can stretch three into five or six.
6. What’s the difference between an SLA and a KPI?
An SLA is an agreed service commitment, while a KPI is a performance measure. Response time can serve as both.
An SLA breach may trigger a defined consequence, such as a service credit. A KPI miss usually triggers internal review or action.
7. What’s the difference between an SLA, an SLO and an SLI?
A Service Level Indicator is the actual measurement, such as your recorded first response time. A Service Level Objective sets your internal target, while an SLA makes a customer-facing commitment. Teams often set the SLO higher than the SLA to catch problems early.
8. Does an automatic reply count as a response?
It can, if the SLA explicitly defines an automated reply as the response event. For a human-response SLA, the clock should stop only when a person replies.
9. Should time waiting on the customer count toward the SLA?
The SLA should explicitly state whether customer waiting time counts. If it pauses the clock, define exactly when the pause starts and ends. Either approach can work, but an unwritten rule will create disputes.
10. How do email teams measure SLA response time without a ticketing system?
Use email timestamps to measure the gap between the received message and the reply. This works across shared mailboxes without creating tickets.
Subtract the two timestamps to calculate response time. Then define how you handle automated replies, follow-ups, threads, and business hours.
SLA response time works best when your target reflects your own data. Published tiers are a useful starting point, but teams measure different things, so external benchmarks rarely translate directly.
Start with four to eight weeks of response-time data. Review the median and 90th percentile, define what counts as a response, and set a target your team can support.
Want to see how this works across a shared mailbox in Outlook or Gmail? Book a demo with timetoreply to see how email SLA tracking works.
Get live inbox alerts and reply quickly to customer emails with timetoreply

CEO @ timetoreply
Howard Moodycliffe is CEO of timetoreply, an email analytics & relationship intelligence platform for B2B customer-facing teams. He writes about email performance, SLA management, and how organisations can use communication data to protect customer relationships and revenue.



Trusted by high-performing inbound sales teams and customer-facing teams globally.
Close more deals and delight more customers with the faster, smarter, deeper email analytics and performance optimization software that works straight from your team’s inbox.