Delivering exceptional customer service is vital for organizations striving to thrive in today’s hyper-competitive business landscape. But it can be difficult figuring out the impact and effectiveness of your efforts. And that’s where customer service metrics come into play, offering a concrete framework by which you can assess performance and measure the success of your customer service initiatives.
By monitoring and assessing certain customer service metrics, you can understand the impact of your team’s response level on customer satisfaction and the overall effectiveness of your support team.
This comprehensive guide dives deep into key customer service metrics that are crucial to track for evaluating and improving performance. These metrics provide tangible data and actionable information, enabling you to make informed decisions and optimize customer service strategies.
Understanding the significance of these customer service metrics and how to interpret them will ensure you can identify areas for improvement, enhance the support experience, and drive customer retention.
Read on to learn how to supercharge your customer service efforts. With this, you can reduce customer churn and elevate your business to new heights of success.
Customer service metrics are quantifiable measurements that can be used to assess the efficiency, performance, and skills of your customer support teams. They encompass key performance indicators for email marketing, customer engagement, and other factors across various aspects of the customer service journey. Tracking customer service metrics can help you identify issues and make data-driven decisions to improve customer interactions.
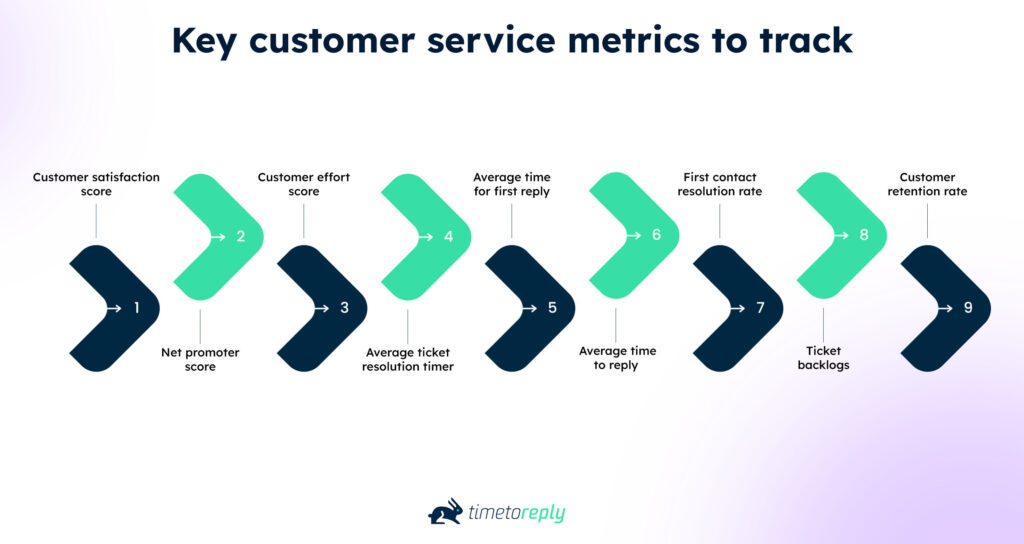
Let’s delve into nine customer service metrics that provide valuable insights into customer satisfaction, loyalty, and operational efficiency. Each metric is crucial in evaluating and optimizing your customer service strategies.
CSAT is one of the key customer service metrics that measures customer satisfaction based on a specific interaction or their overall experience. It shows just how successful your customer service efforts are in meeting customer expectations. It is typically obtained through post-interaction surveys or feedback forms, where customers rate their satisfaction on a scale.
After a support ticket is resolved or a purchase is completed, customers are asked to rate their satisfaction with the experience. The most common format is a simple question like: “How satisfied were you with your experience?”, with response options ranging from 1 (very dissatisfied) to 5 (very satisfied).
To calculate CSAT, use the following formula:
CSAT score (%) = (Number of satisfied customers ÷ Total customers) × 100
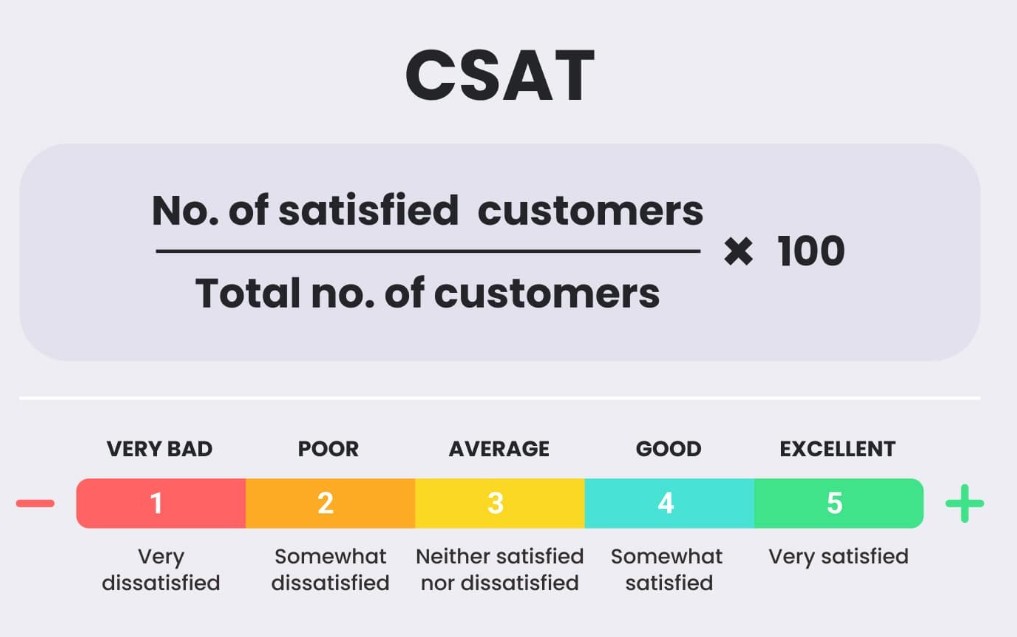
Image via Arahoster
A higher CSAT score indicates a greater percentage of happy customers. On the other hand, a lower score could signal gaps in service quality, communication, or expectations.
If you find you have a poor CSAT score, there are several measures you can take to improve matters.
An effective strategy is sending customer appreciation emails, which shows your commitment to customer care and helps build lasting brand loyalty. You can also follow up with unhappy customers to learn more about their experience and show that you value their feedback.
Also Read:
Want to know how loyal your customers are, and if they’d recommend your business to others? NPS is one of the perfect customer service metrics to monitor for this. Simply ask customers to rate, on a scale of say 1 to 10, the likelihood of them recommending your brand to a friend or colleague.
Based on their responses, you can group customers into three categories:
Calculate the percentage of promoters and detractors. Then, subtract the percentage of detractors from the percentage of promoters, and you get your NPS score. Take a look at this example of how to calculate the NPS score.
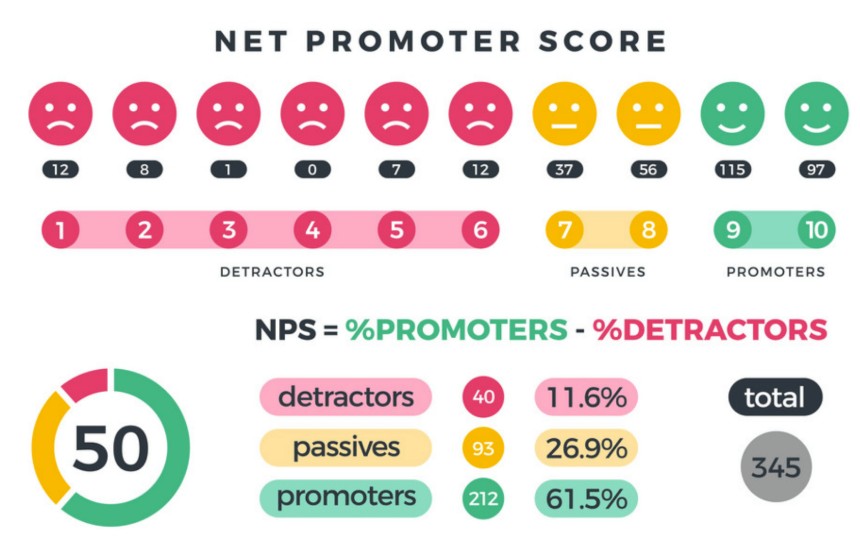
Image via Giovanny Cifuentes
A higher score indicates more satisfied and loyal customers. Tracking NPS over time can help you identify trends, respond to customer concerns, and enhance the overall customer experience.
Wondering how easy it is for your customers to get things done? One of the major customer service metrics that answers this is CES. It measures the ease of the customer experience when resolving issues or completing tasks.
Among other customer service metrics, CES quantifies the effort customers have to put in when interacting with your customer service team. The lower the CES score, the smoother and more effortless the experience for your valuable customers.
While customer service metrics like CSAT and NPS focus on overall satisfaction and loyalty, CES zeroes in on the immediate customer experience.
Reducing customer effort is one way to increase customer loyalty and decrease churn. When customers can’t easily get help, they’re far more likely to switch to a competitor.
Even if the issue gets resolved, if the customer has to go through a long, complicated process, it can create a negative impression. By monitoring CES with customer support tools, your business can identify friction points in the customer journey and adjust support operations accordingly.
To measure CES, you typically need to send a survey to customers who have contacted your support team. The survey question is usually phrased like this: “How easy was it to get your issue resolved today?”
Respondents can then rate their experience on a Likert scale, commonly ranging from 1 to 7, where:
Here’s the formula to calculate CES:
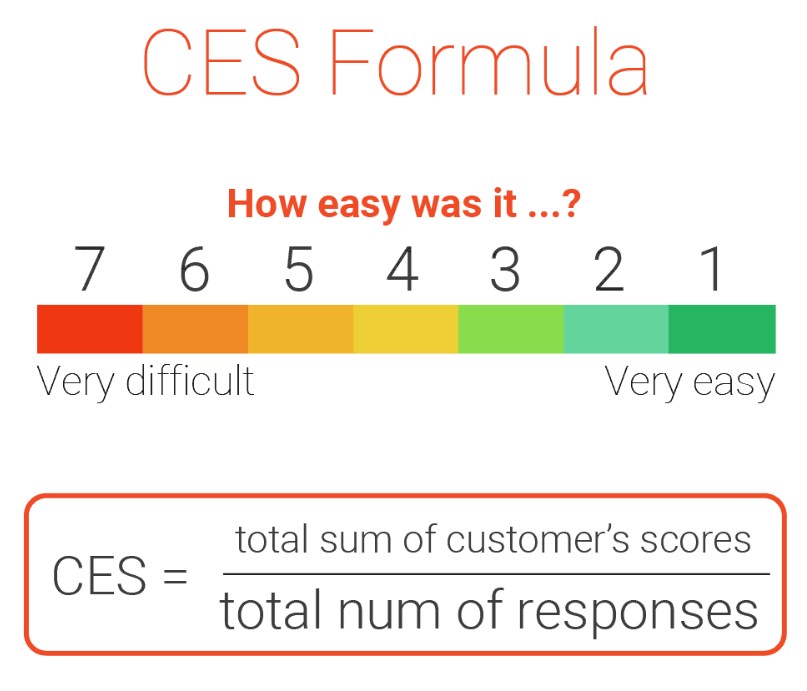
Image via DANAconnect
Some companies use a 5-point or 10-point scale. However, the 7-point scale is commonly used because it’s simple yet specific.
If your CES score is high, it’s a signal to investigate which touchpoints are causing customers to exert too much effort and why.
Also Read:
Keep tabs on your support team’s performance with this metric that tracks the average duration to resolve customer issues or tickets. That is, from the moment the ticket is created to the point it’s marked as resolved or closed. By monitoring and reducing the time it takes to resolve tickets, you’ll enhance customer satisfaction and boost operational efficiency.
The formula for calculating average ticket resolution time is straightforward:
On customer support tools, average resolution time is often displayed using line graphs on the reporting dashboard. These visuals show average resolution time per day, week, or month, giving a clear view of trends over time. See this example of such a graph on Teamwork.
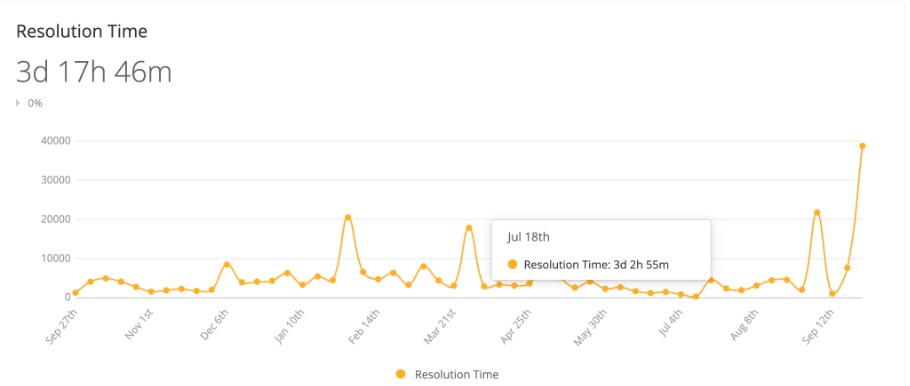
Image via Teamwork
A high resolution time means tickets are staying open longer than they should. This can indicate inefficient workflows or poor internal communication. It can also mean that your customer support agents are understaffed and overworked.
How fast does your support team react? Track customer service metrics like the average time it takes for your first response to your customers to find out. Prompt first replies signal that your company values its customers and that their concerns are being taken seriously.
Even if the issue takes longer to resolve, a fast first response helps manage customer expectations and provide reassurance that their query is being handled. In many cases, simply acknowledging a customer’s message and providing a timeframe for resolution can do wonders to improve satisfaction.
From an operational perspective, this metric also shows how effective and prompt your team is. When tracked over time, it helps identify performance trends, evaluate staffing needs, and optimize workflows.
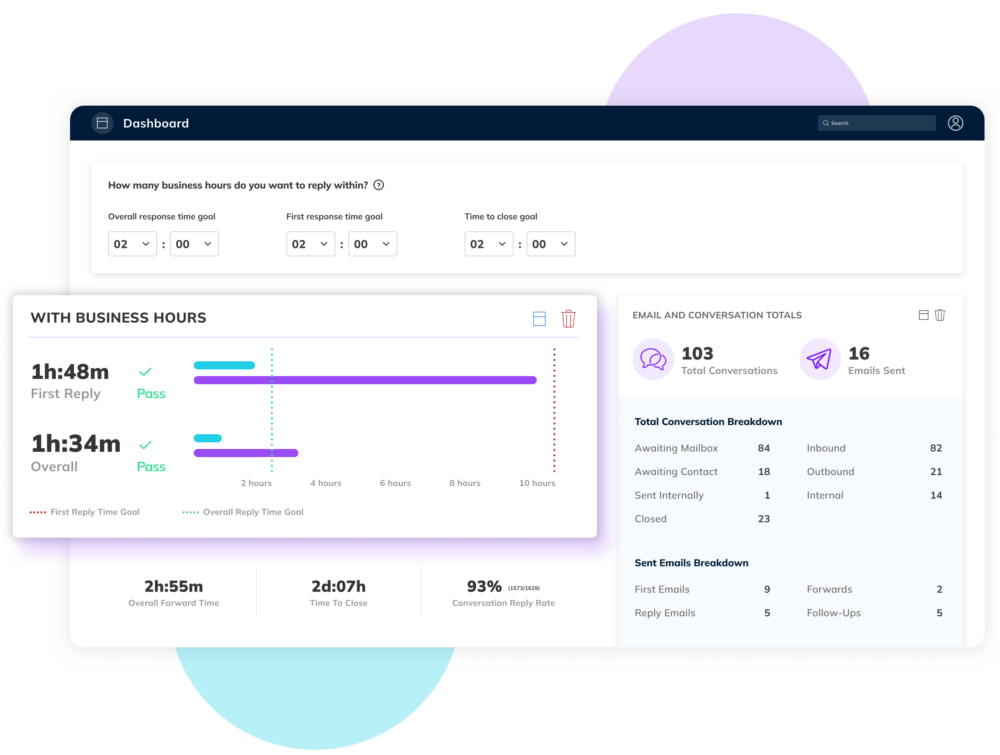
For instance, on timetoreply’s reporting dashboard, you can track your team’s average first reply time against your benchmark or SLA target.
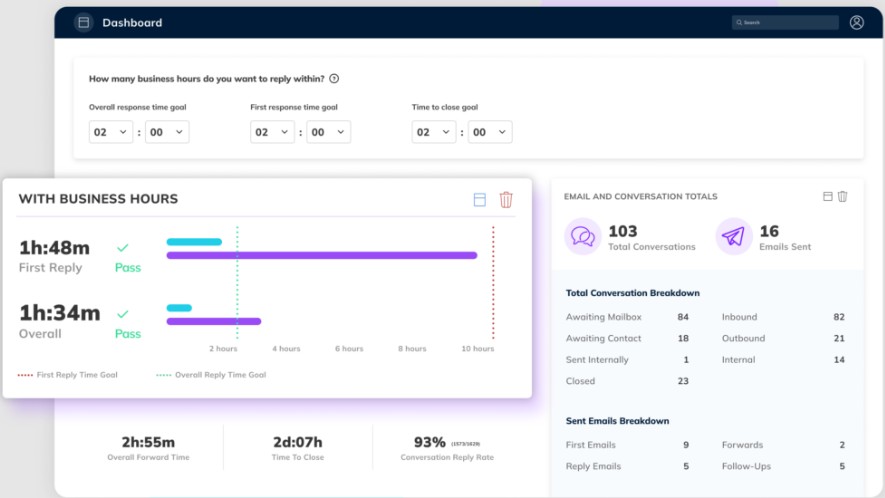
Image via timetoreply
Another one of the most important customer service metrics to monitor is average time to reply. This metric measures the average time it takes for subsequent replies or follow-up emails to customers.
Monitoring and minimizing the average time to reply ensures timely and consistent communication, fostering customer satisfaction and engagement.
Timely follow-up replies are important for managing multi-step inquiries. If a customer has to wait days for a response to a clarification or a next-step query, it can negatively affect their experience. Over time, delays in email response can lead to lower satisfaction scores, reduced trust in your service, and increased churn.
A study by SuperOffice found that the average response time is 12 hours, with the slowest responses taking over 8 days and the fastest as quick as 1 minute.
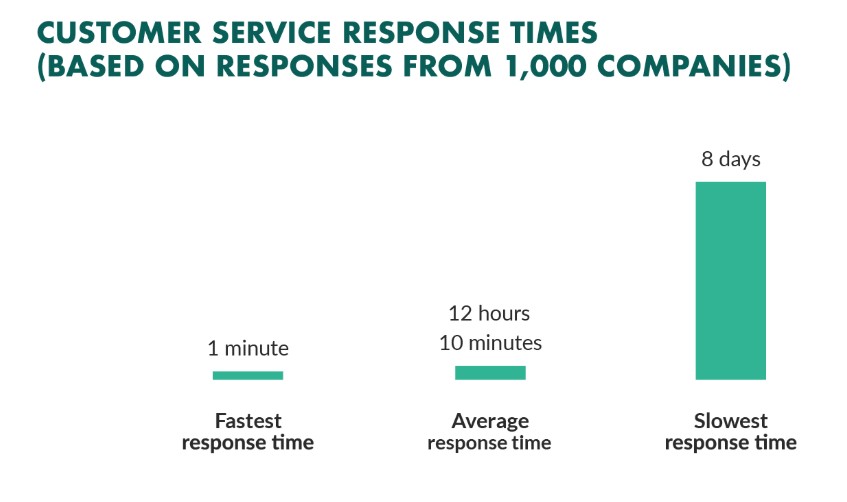
Image via SuperOffice
This data highlights the wide gap in service quality and the potential competitive advantage for businesses that prioritize speed and consistency in email communication.
Also Read:
This is one of the key customer service metrics to pay attention to because it directly impacts customer satisfaction. It measures the percentage of support inquiries that are fully resolved during the first interaction. This means you didn’t have to send follow-up emails or handle callbacks.
When a customer reaches out for help, you’d ideally want to resolve their issue right away, be it via email, chat, or phone. Every time a customer has to re-explain their problem, follow up for an update, or get transferred between agents, it adds friction to the experience.
First contact resolution rate captures how often your team is able to eliminate that friction by resolving issues quickly and efficiently on the first point of contact.
According to SQM Group’s report, the average FCR rate across all industries is approximately 68%. However, performance varies widely by sector, with industry-specific benchmarks ranging between 39% and 91%.
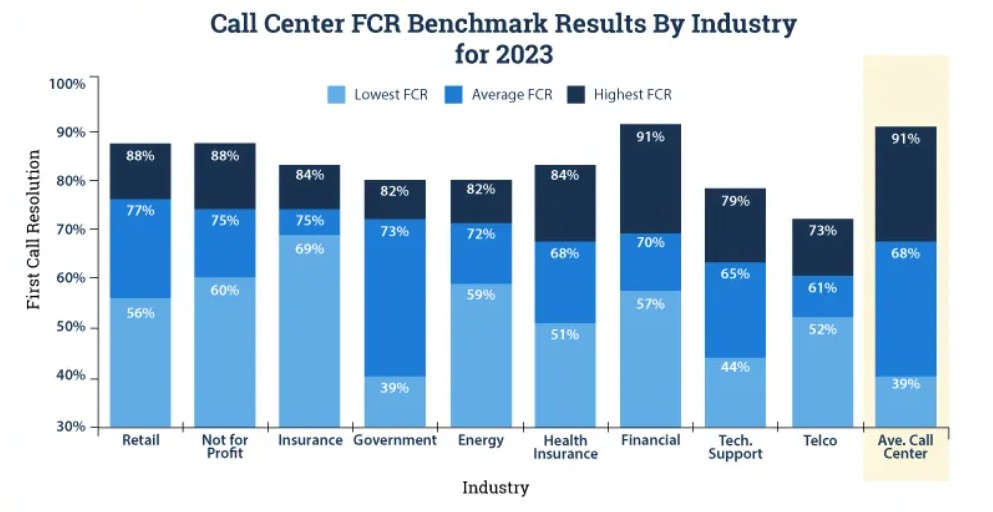
Image via SQM Group
When customers consistently receive replies quickly during their first contact, their trust in your service grows. Fewer follow-ups also reduce ticket volume over time. To improve FCR, support teams need the right tools and training to handle issues without unnecessary delays or transfers.
This refers to the total number of unresolved or open tickets that have not been addressed within your expected timeframe. It’s a powerful metric for assessing workload balance, support capacity, and operational health within your customer service team.
For example, this operational report on Atera displays the daily count of tickets that were opened, closed, and left in the backlog over a specified period.
With such data, you can assess your customer-facing teams’ skills, identify workload spikes, and evaluate how efficiently they manage incoming requests.
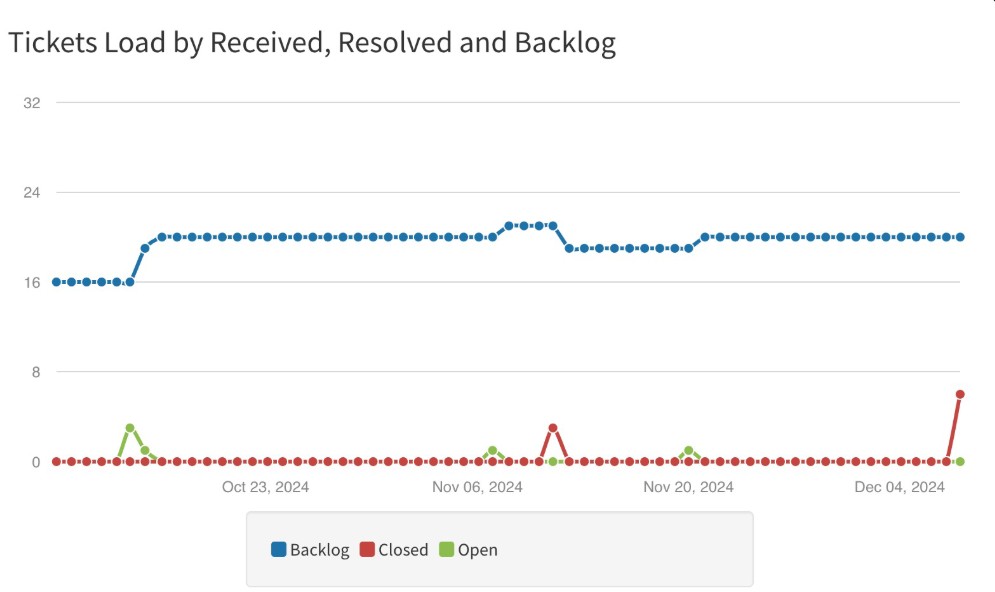
Image via Atera
A growing ticket backlog can be an early warning sign that your team is overwhelmed or that existing workflows aren’t keeping up with demand. Other common causes of high ticket backlog include:
When queries sit unresolved for too long, customers may become frustrated, causing your CSAT and NPS scores to drop. This is why it’s important to regularly review ticket backlog to ensure that you deliver faster and more responsive service.
This is one of the most strategic customer service metrics for evaluating long-term business health. It measures the percentage of customers a business retains over a given period. This data indicates how effective your customer service efforts are at maintaining strong, ongoing relationships.
A high retention rate suggests satisfied customers who are likely to continue buying from your brand. On the other hand, a low rate often points to issues in service quality, value perception, or overall customer experience.
A recent report by First Page Sage shows average customer retention rates across different industries. This data can help you benchmark your performance and set realistic retention goals for your business.
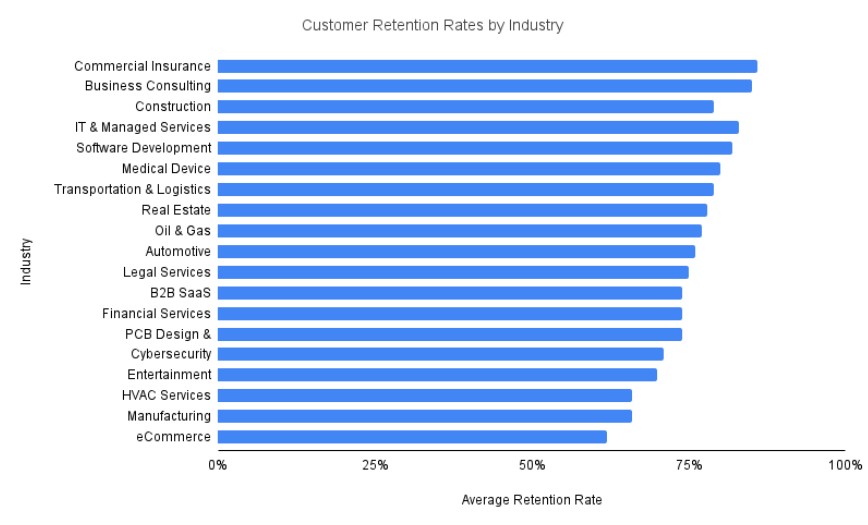
Image via First Page Sage
When CRR is analyzed alongside other customer service metrics like CSAT, NPS, and FCR, you can paint a more comprehensive view of customer satisfaction and loyalty.
Since businesses often spend more to acquire new customers than to retain existing ones, tracking and improving CRR is a cost-effective strategy for boosting profitability. Companies with high retention rates would benefit from recurring revenue and increased lifetime value per customer.
Also Read:
Delivering prompt customer service resolution should be a top priority for businesses, even those managing remote customer service teams, and incorporating effective strategies can make all the difference.
From harnessing the power of customer service metrics to leveraging timetoreply’s advanced customer service email analytics, these tips will help you optimize your approach and leave your customers satisfied.
This won’t come as a surprise! Take advantage of customer service metrics to gain insights into your performance and improve response time. Measure metrics like CSAT, NPS, CES, and the others we’ve outlined above to understand customer satisfaction and loyalty levels. This data-driven approach allows you to identify areas for improvement, make informed decisions, and take proactive measures to deliver quick customer service resolution.
Customers appreciate quick responses. Aim to reduce the average time to first reply and the average time to reply. Effortlessly demonstrate your commitment to exceptional service by promptly addressing customer inquiries and concerns – you can also save valuable time with ready-to-use customer service email response templates as part of your business’s email response time policy or strategy.
Equip your support team with the right training and resources. Encourage active listening, empathy, and problem-solving skills. Foster a positive work culture that values excellent customer service.
Provide comprehensive onboarding and continuous education to help agents master proper email etiquette. This way, they can stay updated with tools, processes, and customer expectations. When support agents feel confident and supported, they’re more likely to handle customer issues efficiently and professionally.
Also Read:
Customers want to feel seen and understood, not just a number in a queue. So, it’s important to tailor responses to suit their experiences. When customers receive a response that reflects their individual needs, it builds trust, increases satisfaction, and enhances brand loyalty.
Automation can improve team efficiency, but only when implemented thoughtfully. You can use tools like chatbots and trigger-based email responses to handle routine tasks.
However, ensure that complex or sensitive queries are promptly routed to human agents. The goal is to free up your team to focus on higher-value interactions while still delivering timely responses.
Customer feedback is a goldmine for improving service quality. You can gather feedback from customers through surveys, email follow-ups, or post-interaction forms.
Make it easy for customers to share their experiences, both good and bad, and pay close attention to recurring themes. Then, analyze the feedback and implement changes where needed.
Also Read:
Effective internal collaboration is an important aspect that can affect key customer service metrics. Encourage transparent communication across departments using customer support tools with collaborative features, especially when solving complex customer problems that need input from various departments.
Also, you can use shared mailboxes to reduce miscommunication and duplicated efforts. When your team works as a cohesive unit, issues will get resolved faster, and customers will receive consistent information no matter who they speak to.
Clear communication can set the tone for effective customer relationships. It’s important to be upfront about service timelines, policies, and limitations.
If your team promises a callback within 24 hours or a refund within seven days, make sure to honor this commitment. Even when challenges arise, honest communication and consistent follow-through can turn a negative experience into a positive one.
Also Read:
To deliver excellent customer service, you need the right tools to measure and monitor customer service metrics and manage performance. It’s important to choose solutions that easily integrate with your existing systems and can offer actionable insights to enhance productivity.
Here are some essential tools support teams can use to measure customer service metrics:
For teams that rely heavily on email for customer communication, email analytics tools are important to provide accurate, real-time data on key email performance metrics.
Unlike traditional email clients like Microsoft Outlook or Gmail with basic analytics, dedicated email analytics tools can give businesses visibility into individual and team-wide performance. It helps track email response time, identify response bottlenecks, and ensure timely, professional communication across all customer emails.
Some examples of email analytics tools you can use to measure customer service metrics include timetoreply, Email Meter, Zendesk, EmailAnalytics, and more.
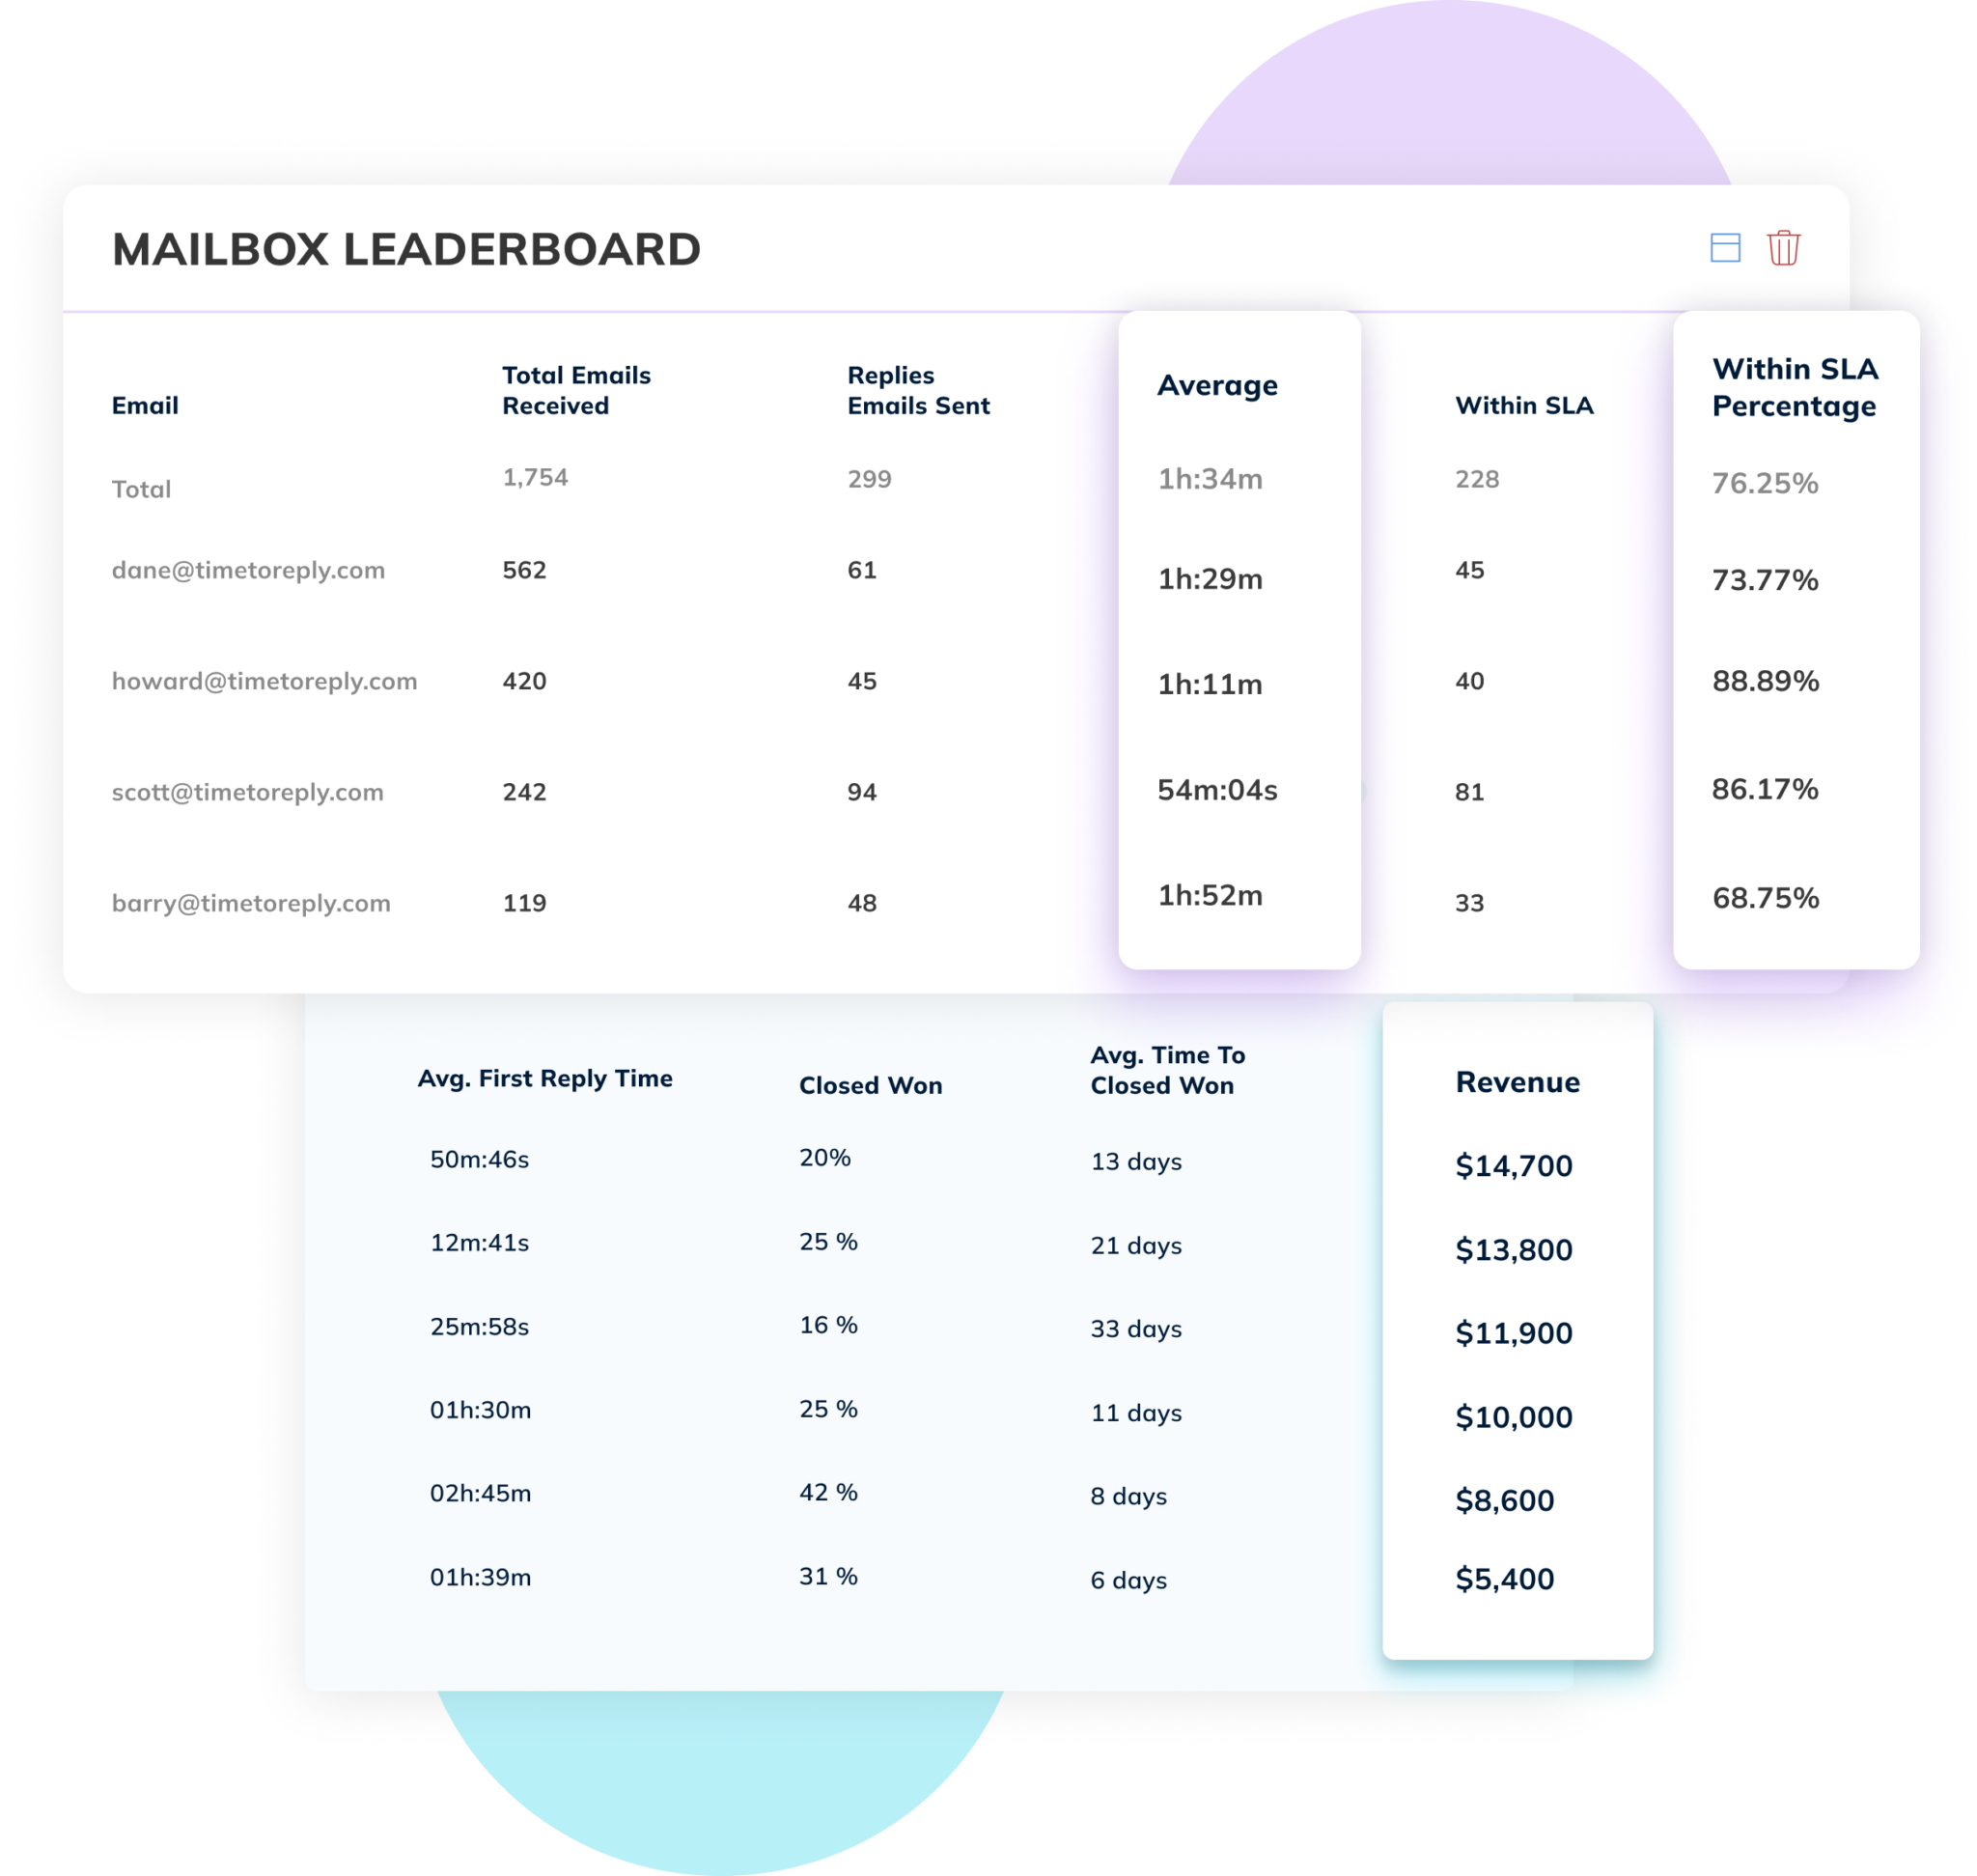
For instance, being a dedicated email analytics tool, timetoreply provides features for measuring and improving email reply performance. Since it integrates directly, it offers analytics for Outlook and Gmail without changing your team’s workflow.
It offers real-time reporting for shared mailboxes, including average email response time and SLA compliance, which makes it perfect for sales and customer support teams.
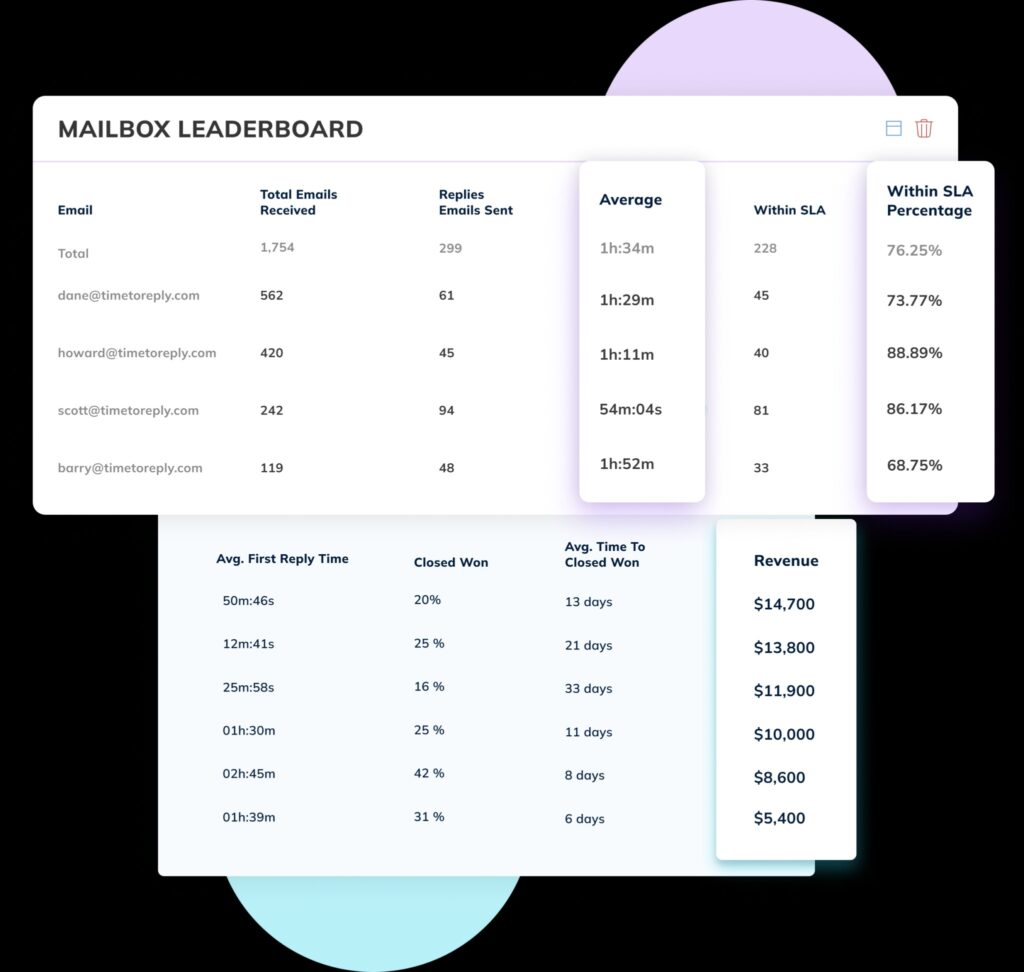
Image via timetoreply
These platforms can streamline customer interactions by centralizing all communication channels into a single dashboard. These tools often include built-in analytics dashboards to monitor customer service metrics.
They’re ideal for teams who want to automate ticket routing and scale their support efforts. Help desk tools can automatically log every customer inquiry as a ticket and categorize it by time, topic, or channel. This helps track metrics like ticket volume, resolution time, and more.
Additionally, several help desk tools capture timestamps at each stage of the support lifecycle to help monitor time-based customer service metrics.
Here are some widely used help desk platforms:
Also Read:
To understand how customers truly feel after an interaction, collecting direct feedback is important. Survey tools are the most effective way to do that.
With survey platforms, support teams can send automated post-interaction surveys that measure key customer service metrics like CSAT, NPS, and CES.
Some popular survey tools you can use to measure customer service metrics are:
The tools can be integrated with your service desk solution to trigger surveys at the right time, such as immediately after a ticket is closed or a live chat ends. The results can then be analyzed within the survey tool itself or synced to your analytics platform for trend analysis.
Besides scores, survey tools often let you gather written answers that explain why users gave certain ratings. This qualitative feedback can highlight recurring themes, such as delayed responses or dissatisfaction with communication tone.
Here’s an example of the types of survey questions that can be created and customized on SurveyMonkey.
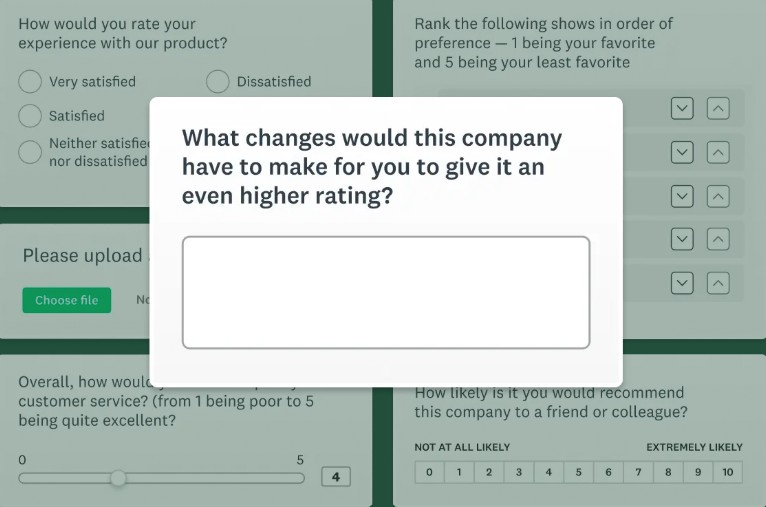
Image via SurveyMonkey
Customer relationship management (CRM) platforms centralize and manage all interactions your business has with customers across sales, marketing, and support. These platforms often have built-in analytics features. That’s why they’re powerful tools for measuring customer service metrics at every stage of the customer lifecycle.
With all customer data, such as support history, sales activity, feedback scores, and communication logs, stored in one place, businesses can monitor every customer inquiry across service touchpoints.
Popular CRM platforms with built-in customer service analytics include:
These CRM tools often have automation features like assigning tickets and sending alerts when important customers are affected.
With CRM tools, support teams can also generate reports that track support activity by customer segment, team, channel, or agent. For example, on HubSpot, you can view reports on your team’s performance based on filters like categories, channel, support pipeline, team, and more.
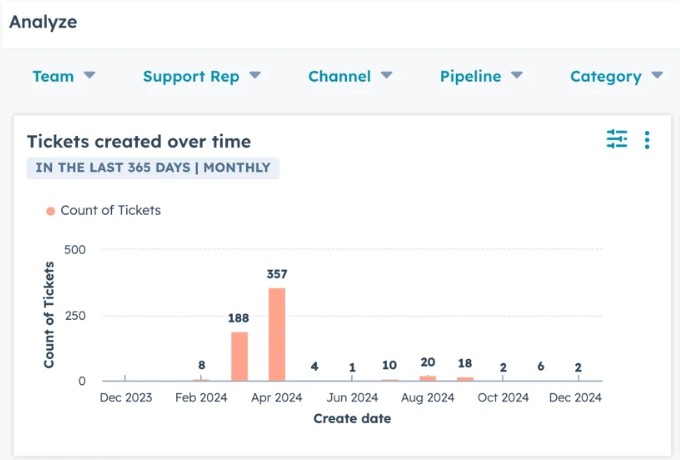
Image via HubSpot
This level of detailed reporting makes it easier to track key customer service metrics, understand agent performance, and prioritize areas for improvement. Moreover, because CRMs often integrate with marketing and sales platforms, service teams can collaborate with other departments more efficiently.
Also Read:
While they’re not dedicated analytics tools like EmailAnalytics and its alternatives, team collaboration platforms can integrate with your customer service tools to bring insights directly into your workflows. You can receive real-time notifications for customer service SLAs or high-priority tickets, all in the channels where your team is already working.
Many collaboration platforms also support third-party performance add-ons or direct integrations that bring dashboards, alerts, and reports right into your team workspace. With these add-ons, managers can monitor basic customer service metrics like agent activity, response timelines, and ticket statuses.
For example, custom dashboards can be set up within the platform to display customer service metrics pulled from your help desk or email analytics software.
Here are some popular team collaboration tools that can integrate with your support systems and help monitor relevant customer service metrics:
Slack, for example, allows integration with several help desk tools, including Zendesk and its alternatives, for support ticket management.
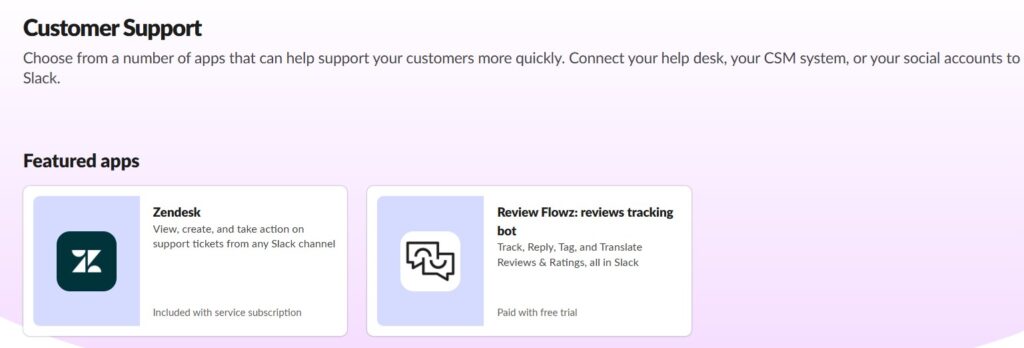
Image via Slack
Many customers prefer chat to communicate with businesses because it’s fast and accessible. With live chat or messaging tools, customers can initiate real-time conversations directly from your website, app, or social media channels.
Beyond the apparent benefit of instant communication, live chat tools offer analytics and performance-tracking features. Integrated chat dashboards allow customer service teams to monitor key customer service metrics.
Many live chat platforms also offer post-chat surveys that can capture feedback on the customer’s experience, providing insights into support quality.
Here are some widely used live chat and messaging platforms that support customer service metrics tracking:
Yes, we’ve covered a lot of information. So it’s worth repeating that the nine essential customer service metrics to track for success are:
Tracking and analyzing these customer service metrics is essential to understanding and enhancing customer support performance. And you don’t have to stop there. Software solutions like timetoreply can help you take your customer service to new heights and measure the effectiveness of your touchpoints.
Also Read:
1. Are customer service metrics important for business success?
Yes. Customer service metrics are important because they offer measurable insights into how well your support team is performing. When you consistently track customer service metrics, you can identify strengths and areas for improvement.
These metrics help you understand customer expectations, satisfaction levels, and potential roadblocks in the service journey. Without customer service metrics, decision-making becomes guesswork instead of being data-driven.
2. Can customer service metrics help reduce customer churn?
Yes. Customer service metrics help identify and prevent customer churn. Metrics like CSAT and NPS can flag early dissatisfaction, which gives you time to take corrective action. If these customer service metrics show declining scores, it’s often a sign of a deeper issue that needs to be addressed.
Also, response time metrics, including first reply time and resolution time, highlight delays that might be driving customers away. If you continuously monitor these customer service metrics, you can implement proactive solutions before customers decide to leave.
3. Which customer service metrics should small businesses track?
Small businesses should focus on tracking customer service metrics that provide actionable insights without overwhelming their team or resources. Some of the crucial customer service metrics include:
4. What kind of tools can be used to measure customer service metrics?
You can use a variety of tools that capture performance data, effectively measuring key customer service metrics:
5, How often should businesses track their customer service metrics?
Businesses should monitor their customer service metrics regularly. Ideally, on a weekly or monthly basis, depending on the size and activity level of their support team.
By frequently analyzing your customer service metrics, you’re more likely to catch performance trends early on. This helps you respond to any negative changes before they impact customer satisfaction.
Also Read:
With powerful email analytics and monitoring tools, timetoreply enables you to effectively track and optimize your customer service response times. It provides real-time analytics, response time tracking, and team performance insights.
Timetoreply has helped businesses slash response times from 7 to 2 hours and skyrocket response rates from 65% to 90%+ within 8 hours of activation. With timetoreply, witness remarkable improvements in your customer service performance and retention, and enjoy a reduction in customer churn.
Ready to revolutionize your customer service? Try timetoreply Success today and unlock the power of data-driven insights, optimized response times, and team performance tracking. With timetoreply, you’ll gain a competitive edge, improve customer satisfaction, and drive business growth. Don’t wait – try our 15-day free trial or request a demo.
Get live inbox alerts and reply quickly to customer emails with timetoreply

Head of Customer Success @ timetoreply
Barry Blassoples is the Head of Customer Success at timetoreply, where he helps customer-facing teams boost revenue and protect brand reputation by providing actionable insights to improve their business email response times. He has over 15 years of leadership experience across customer success, sales, and marketing roles in high-growth tech companies.


Trusted by high-performing inbound sales teams and customer-facing teams globally.
Close more deals and delight more customers with the faster, smarter, deeper email analytics and performance optimization software that works straight from your team’s inbox.